Electromagnetic Sounder Experiments at the Pyramids of Giza
By Joint ARE-USA Research Team:
Ain Shams University
Cairo, A.R.E.
N. Barakat
T. El Dessouki
H. El Hennawi
A. H. Moussa
M.F. Tolba
S. Abdel-Wahab
Stanford Research Institute
Menlo Park, California, U.S.A.
L. T. Dolphin, Jr.
R. L. Bollen
D. A. Johnson
G. N. Oetzel
J. D. Tanzi
Organization of Antiquities
G. Mokhtar
A. Hassan
Lawrence Berkeley Laboratory
University of California, Berkeley
S. O. Buckingham
Prepared for:
Office of International Programs
National Science Foundation
Washington, D.C. 20550
NSF Grant No. GF-38767
ABSTRACT
A Joint Egyptian-American research team conducted electromagnetic sounder
experiments during autumn 1974 with the primary objective of locating archaeologically
significant chambers in the Giza area. Radio-frequency losses in the limestone
rock of the area, ranging from 6 dB/m at 10 MHz to 25 dB/m at 150 MHz,
appear to preclude much practical application of radio-frequency sounding
in the vicinity of Giza. The high losses are contrary to expectations based
on samples analyzed before the Giza experiments, but are consistent with
later laboratory analyses made at the high temperature and high humidity
characteristic of the Giza environment.
Exploration of the pyramids in conjunction with the experiments yielded
two additional discoveries of interest. A number of quarry marks and what
appear to be alignment markings which may have been used during pyramid
construction were located in the excavation on the north side of Mycerinus'
pyramid. Observation of construction practices made visible by the digging
efforts in various forced entrances disclose a much more common use of
irregular blocks and debris fill, particularly in Chephren's and Mycerinus'
pyramids, than is commonly appreciated. These construction practices may
have a significant bearing on the design of future sounding experiments.
CONTENTS
ABSTRACT
LIST OF ILLUSTRATIONS
ACKNOWLEDGMENT
I. HISTORY OF THE PROJECT
II. FIELD EXPERIMENTS AT GIZA: PROPAGATION MEASUREMENTS
AT THE PYRAMIDS OF CHEPHREN AND CHEOPS
III. FIELD EXPERIMENTS AT GIZA: PROPAGATION MEASUREMENTS
AT THE PYRAMID OF MYCERINUS
IV. FIELD EXPERIMENTS AT GIZA: PROPAGATION MEASUREMENTS
AT A CHEPHREN BOAT PIT
V. LABORATORY MEASUREMENTS OF EGYPTIAN ROCKS
VI. OBSERVATIONS ON CONSTRUCTION OF THE PYRAMIDS
VII. SUMMARY AND RECOMMENDATIONS
APPENDICES
A. ELECTROMAGNETIC SOUNDER EQUIPMENT FOR PROBING THE
PYRAMIDS
B. PROPAGATION OF ELECTROMAGNETIC WAVES IN ROCK
C. MINERALOGICAL DESCRIPTION OF TWO SAMPLES OF GIZA
LIMESTONE
REFERENCES
ILLUSTRATIONS
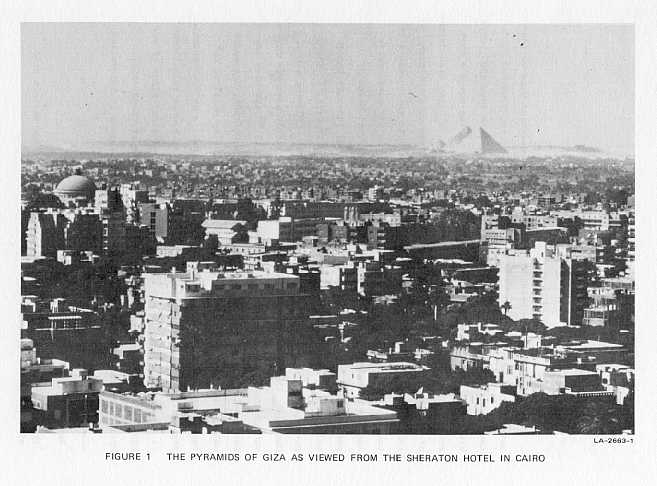
1. The Pyramids of Giza as Viewed from the Sheraton Hotel in Cairo
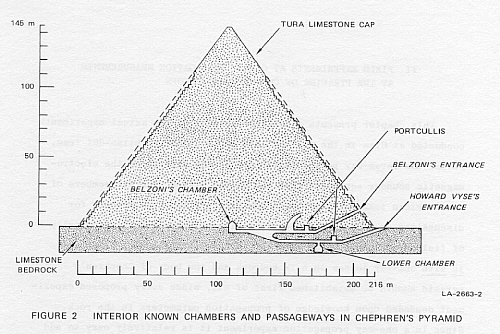
2. Interior Known Chambers and Passageways in Chephren's Pyramid
3. Detailed Geometry of the Interior of Chephren's Pyramid
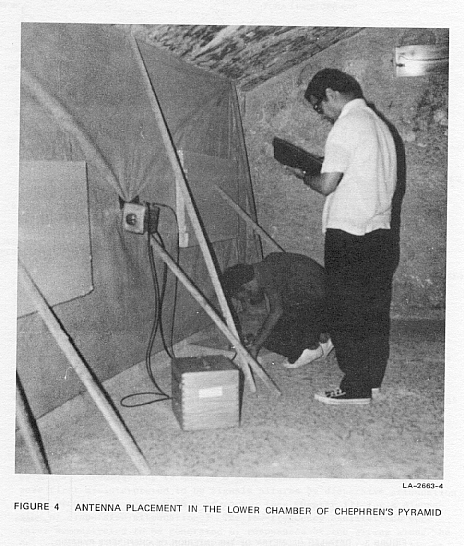
4. Antenna Placement in the Lower Chamber of Chephren's Pyramid
5. Receiving Antenna Mounted on North Wall of Belzoni's Chamber
6. Oscilloscope Setup in Belzoni's Chamber
7. Geometry of Propagation through North Face of Chephren's Pyramid
8. Climbing Team Installing Equipment on North Face of Chephren's Pyramid
9. Typical A-Scope Photograph of Sounder Signals
10. Map of the Giza Necropolis
11. Photograph of 10-MHz Sounder on East Face of Chephren's Pyramid
as Seen from the Summit of Cheops' Pyramid
12. Sounder Emplacement near Air Shaft on South Face of Cheops' Pyramid
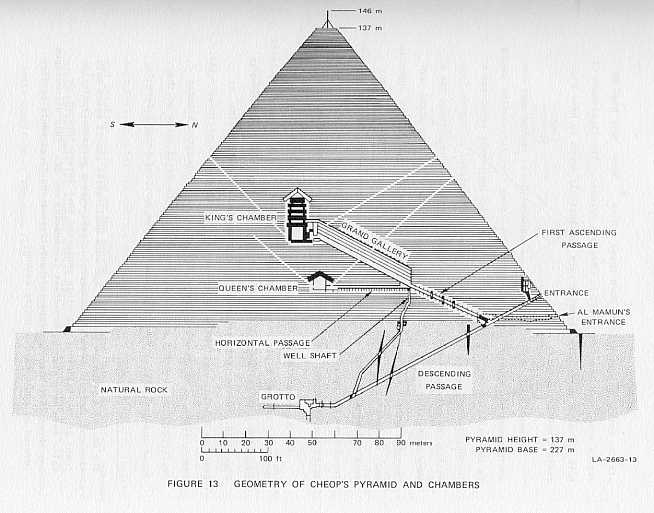
13. Geometry of Cheops' Pyramid and Chambers
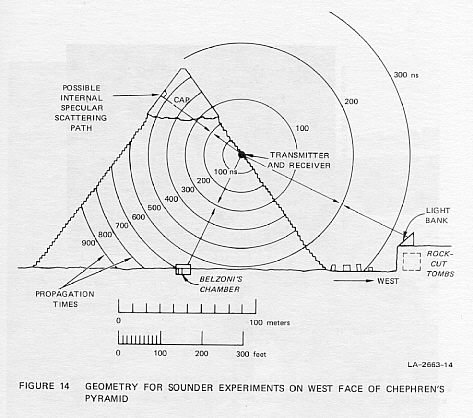
14. Geometry for Sounder Experiments on West Face of Chephren's Pyramid
15. A-Scope Photograph of Reflections with Sounder on Chephren's Pyramid,
West Face
16. Photograph of 10-MHz Sounder on Lower North Face of Chephren's
Pyramid
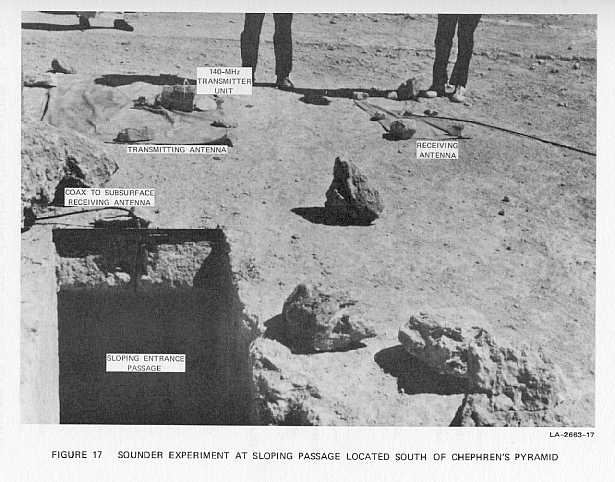
17. Sounder Experiment at Sloping Passage Located South of Chephren's
Pyramid
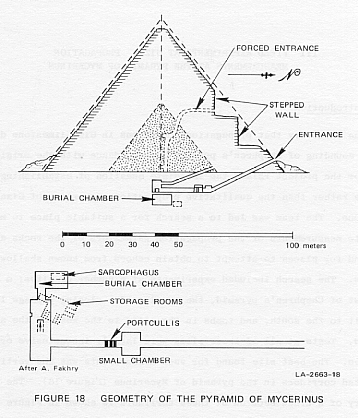
18. Geometry of the Pyramid of Mycerinus
19. Detail of the Interior Corridors of Mycerinus' Pyramid
20. A-Scope Displays of 50-MHz Data
21. Results of Attenuation Measurements between Corridors of Mycerinus'
Pyramid--50 MHz
22. Propagation-Time Measurements--50 MHz
23. Typical A-Scope Displays of 125-MHz Data
24. Results of Attenuation Measurements between Corridors in Mycerinus'
Pyramid--125 MHz
25. Echoes from Corridors of Mycerinus' Pyramid at 14-Foot Station
26. Overlay of A-Scope Photographs To Emphasize Echoes
27. Variation of Received Frequency with Propagation Distance
28. Pulse Calculated from Simple Computer Propagation Model
29. Dispersed Waveforms Obtained from Model
30. Comparison of Computer Model Calculations with Experiments
31. Summary of the Four Attenuation Measurements in the Corridors of
Mycerinus' Pyramid
32. Boat Pits to the East of Cheops' Pyramid Seen from the Summit
33. Covered Boat Pit East of Chephren's Pyramid
34. Open Boat Pit East of Chephren's Pyramid
35. Geometry for Boat Pit Experiment
36. Results of Boat Pit Experiment--Differential Measurements
37. A-Scope Display of Boat Pit Data
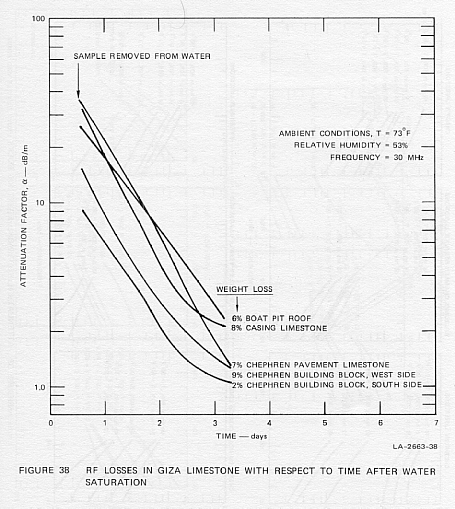
38. RF Losses in Giza Limestone with Respect to Time after Water Saturation
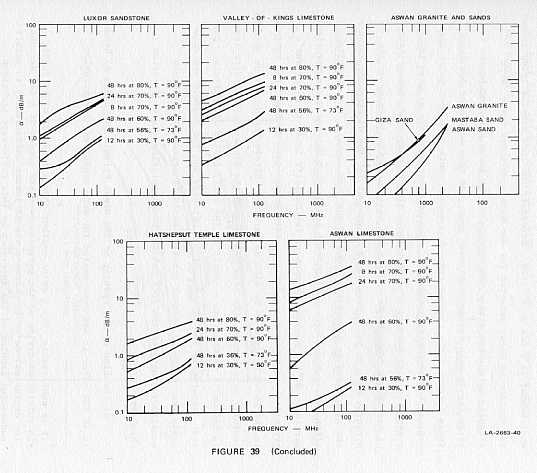
39. Attenuation in Typical Egyptian Rocks
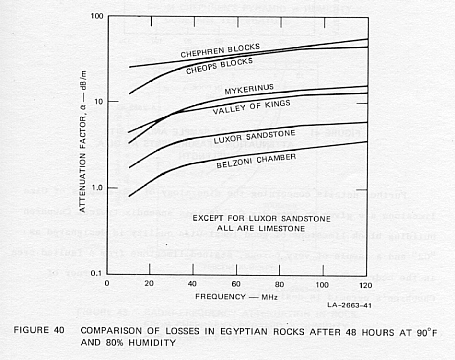
40. Comparison of Losses in Egyptian Rocks after 48 Hours at 90°F
and 80% Humidity
41. Comparison of Sample and On-Site Attenuation Measurements at Giza,
for One Wavelength
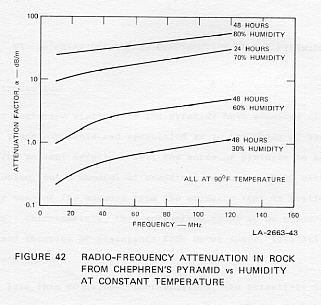
42. Radio-Frequency Attenuation in Rock from Chephren's Pyramid versus
Humidity at Constant Temperature
43. Radio-Frequency Attenuation in Rock from Chephren's Pyramid versus
Humidity for an 85-Meter Path
44. Construction of a Pyramid
45. Irregular Fitting and Fill in Cheops' Pyramid Passage
46. Irregular Blocks in Ceiling of Cheops' Pyramid Passage
47. Mortar Fill in Mycerinus' Pyramid
48. North and East Sides of Mycerinus' Pyramid
49. Debris-Height Line in Mycerinus' Pyramid Excavation
50. Excavation and Forced Entrance in Mycerinus' Pyramid
51. Photograph of Markings on Exposed Stepped Wall
52. Quarry Mark in Interior of Mycerinus' Pyramid Passage
53. Quarry Mark on East Side of Mycerinus' Pyramid Passage
A-1 Schematic Diagram of Electromagnetic Sounder
A-2 Typical Receiving Antenna for Electromagnetic Sounder
A-3 Photograph of 1.2-MW Transmitter Unit and Antenna
B-1 Geometrical Spreading Losses versus Range for Electromagnetic Sounders
B-2 Simplified Schematic for Scattering from an Underground Chamber
B-3 Electromagnetic Scattering for Targets Extended in Range
ACKNOWLEDGMENT
This work was sponsored by the National Science Foundation, Office of
International Programs, under Grant No. GF-38767. We are especially grateful
for this grant and the tireless efforts of Mr. Selim Selcuk in completing
necessary international arrangements and plans on our behalf.
I. HISTORY OF THE PROJECT
Prominent and impressive as they are, the pyramids of Giza on the outskirts
of Cairo (Figure 1) have aroused curiosity and provoked imaginative speculation
in every generation for the more than 4500 years since they were built
in the Fourth Dynasty of one of the world's most ancient and long-lived
civilizations. Yet the sheer bulk and high degree of preservation of these
ancient monuments have prevented a thorough archaeological exploration
of their interiors. Significant portions of the Giza necropolis remain
unexplored, as well. Only in recent years was the rubble cleared away around
the base of the First Pyramid, resulting in the discovery in 1954 of two
magnificent funerary boats belonging to Cheops, builder of the "Great"
Pyramid of Giza.1* The pavement surrounding
the Second Pyramid, that of one of Cheops' son, Chephren, though mostly
cleared, has not been completely searched for subterranean chambers such
as storerooms or boat pits,2* and
clearing the rubble surrounding the Third Pyramid, that of Mycerinus, has
begun only in the last few years. Excavating the pyramids by drilling or
tunneling in search of hidden chambers or passageways is an unacceptable
desecration of the monuments; yet the discovery of a hidden intact tomb
at Giza could easily be one of the greatest archaeological finds of our
century. A lesser discovery such as an intact boat of Chephren or Mycerinus
would still be a find of enormous significance in Egyptology.
Following his first visit to the pyramids in 1962,3 Professor
Luis Alvarez of the University of California at Berkeley, inspired by the
possibilities of finding hidden chambers in the pyramids (especially the
second pyramid, which contains only two significant known chambers), realized
that measurement of cosmic ray flux from within a known chamber of a pyramid
could give information about cavities or voids elsewhere in the main body
of the pyramid. After lengthy preparation and much effort by a joint team
of scientists from the University of California and Ain Shams University
working in cooperation with the Organization of Antiquities, data collection
on cosmic ray flux through the pyramid walls began in mid-1967 in Belzoni's
chamber. Results of the first experiments indicated that within a vertically
oriented cone 35 degrees in half-angle, no unknown chambers were to be
found in Chephren's pyramid. The volume initially surveyed was about 19
percent of the total volume of the pyramid.4 Subsequent measurements
at low angles showed beyond reasonable doubt that no chamber existed in
the remaining portions of the pyramid above the underlying bedrock.5
Proof that the cosmic ray method was successful in "X-raying" the pyramid
was the successful detection of both the Tura limestone cap on Chephren's
pyramid and the "shadow" cast by the pyramid of Cheops when the cosmic
ray detector was pointed north-east at a low angle in the direction of
the Great Pyramid. While such negative results are disappointing, because
no additional chambers were found, the cosmic ray experiments scientifically
were unique and elegant. Furthermore, they were accomplished without disturbing
the pyramid in any way. The principal limitation of the method is inability
to detect unknown chambers beneath the pyramid. A chamber very close to
Belzoni's chamber could escape detection by this method as well. While
the experiment could now be repeated in other pyramids such as Cheops',
greater problems in data interpretation are expected because of the three
large known chambers and the grand gallery in that structure, and multiple
chambers in most other pyramids as well.
In 1972, Dr. Hugo Fellner-Feldegg, of the Hewlett-Packard Corporation
in Palo Alto, California, called SRI's attention to the work of Professor
Alvarez at Giza after he learned of a new SRI-sponsored research program
on remote underground sensing by means of short electromagnetic pulses.
After meeting with Dr. Fellner-Feldegg and Professor Alvarez, the SRI group
decided to direct their efforts toward the development of a portable sounder
that could be used for probing archaeologically interesting objects such
as the pyramids. It was felt that the pyramids might be an appropriate
low-loss environment for underground radio-wave propagation because Giza
is unusually dry, receiving less than one inch of precipitation a year.
(It is the moisture content that primarily governs the attenuation rate
for electromagnetic waves in rocks and soils near the surface of the earth.)
Furthermore, a sample of pyramid limestone tested by Dr. Fellner-Feldegg
in 1972 showed only modest RF losses below 1 GHz.*
Even under favorable conditions, RF losses in most rocks near the earth's
surface are high and increase with increasing frequency rapidly enough
that only relatively low probing frequencies (HF-VHF) are usually appropriate.
Since resolving power (the ability to delineate a chamber using a given
probing wavelength) is poor for wavelengths much longer than the chamber
dimensions, there are also lower limits on the frequency for such sounders,
apart from practical considerations of antenna size and equipment portability.
These considerations led to development by SRI of a family of pulse-echo
sounders operating in the frequency range 10 to 150 MHz. A second set of
constraints, related to the need to detect chambers relatively close-in
to receiver and transmitter, required a radio-frequency pulse extraordinarily
short compared to that used, for example, by radar. In fact, a pulse length
only one or two RF cycles in length is about optimum for most underground
electromagnetic probing applications.
During the development of sounder equipment suitable for use at the
pyramids, a number of potential test sites in California were studied.
RF losses at most prospective sites were found to be prohibitively high,
as expected; however, a dolomite mine, owned by Premier Resources, Inc.,
at Lone Pine, California, in the Inyo Mountains east of the Sierra Nevadas,
provided a suitable test bed.6 Chambers in the mine 100 ft to
150 ft beneath the sounder transmitter and receiver located on the surface
were readily detected through the dolomite rock surrounding the mine workings,
establishing the basic credibility of the sounder technique.
On the strength of these successful feasibility experiments, the SRI
group proposed field experiments at Giza in Egypt to the National Science
Foundation in early 1973. Further impetus was added when two out of three
small fresh samples of limestone from Chephren's pyramid showed electrical
properties apparently favorable enough to permit probing the pyramids by
radio waves. The third sample of pyramid limestone (believed to be casing
stone) exhibited high losses.
The field experiments described in this report were subsequently conducted
in Egypt by a joint Egyptian-American team during the fall of 1974 using
the short-pulse electromagnetic sounder equipment developed by SRI specifically
for this purpose. Further details on the equipment as finally configured
are given in Appendix A. Appendix B discusses the propagation of electromagnetic
waves in rock, and Appendix C gives a mineralogical description of two
samples of Giza limestone.
II. FIELD EXPERIMENTS AT GIZA: PROPAGATION MEASUREMENTS
AT THE PYRAMIDS OF CHEPHREN AND CHEOPS
This chapter presents a detailed account of the actual experiments conducted
at Giza in the fall of 1974 by the joint Egyptian-SRI team. During the
seven-day period that preceded the arrival of the electromagnetic sounder
equipment from the United States, the six members of the American team
met daily with the six Egyptian team members for discussions on propagation
theory, equipment parameters, and priority of field experiments. All soon
agreed that establishment of actual in situ one-way losses in both
bedrock and the body of Chephren's pyramid should be established first
of all, since every proposed experiment depended upon knowledge of propagation
parameters in the rock. Since in a one-way propagation experiment it is
relatively easy to add a third antenna, it was decided to set up the sounder
for simultaneous two-way propagation and one-way propagation experiments
(1) between the lower chamber and Belzoni's chamber in the bedrock beneath
Chephren's pyramid, and (2) between Belzoni's chamber and a point about
half-way up the north face of Chephren's pyramid. Figure 2 shows the interior
known chambers and passageways in Chephren's pyramid, while Figure 3 gives
details of the geometry for propagation between the interior chambers.
Field experiments began September 27, 1974 within the second pyramid.
Transmitting and receiving antennas were emplaced against the south wall
of the lower chamber so that energy could be propagated through bedrock
in the direction of Belzoni's chamber 68 m away. Blocks of styrofoam sheeting
and lengths of light lumber were used to prop the metallized cloth antennas
tightly against the rock walls of the chamber*
(Figure 4). A second receiving antenna was similarly mounted on the wall
of Belzoni's chamber (Figure 5) to receive the one-way energy through the
rock. The receiving oscilloscope and camera were placed in the cosmic ray
experiment enclosure in Belzoni's chamber (Figure 6). Lengths of double-shielded
coaxial cable (RG 9/U) connected the receiving antenna in the lower chamber
to Channel 1 of the oscilloscope, and the antenna in Belzoni's chamber
to Channel 2 of the oscilloscope. Since qualitative observation of the
received signals appearing on the oscilloscope suggested that they were
occurring with approximately the right time delays and amplitude characteristics,
it was assumed that signals were indeed propagating through the rock both
one-way and two-way. Therefore, a number of A-scope photographs were taken
for later numerical analysis. Unfortunately, this analysis was not made
until eight days later, at which time it was soon obvious that propagation
time delays and signal intensities were completely inconsistent with propagation
through the rock--the observed signals were simply being propagated from
chamber to chamber down the outer shield of the coaxial cables, and then
re-radiated. Analysis of the data showed that no detectable signal could
be observed through 68 m of rock between the lower chamber and Belzoni's
chamber at frequencies below 20 MHz. For a transmitted peak power of 1.2
MW, 35 dB of spatial loss [see Appen. B, Fig. B-1(a)] and measured noise
levels, this finding implies that the attenuation loss in the rock was
well above 1 dB/m. On the basis of the earlier laboratory measurements
of various small samples, losses of the order of 0.3 dB/m or less had been
anticipated at a sounder frequency of 10 to 20 MHz.
Following the first propagation experiment between the two Chephren
chambers, but prior to the discovery of the fact that losses in bedrock
were very high, a second set of experiments was set up to study one-way
and two-way propagation between Belzoni's chamber and the north face of
the pyramid (Figure 7).
On September 30, Drs. Tolba and Oetzel, assisted by two Egyptian guides,
began emplacement of transmitter, transmitting antenna, and receiving antenna
on the north face approximately 49 m up the side from the base. (The transmitting
and receiving antennas were approximately 8 m apart.) Figure 8 is a photograph
of the climbing team installing the equipment on the north face. Because
of the steep and highly decomposed surface, care was required in all climbing
operations, not only to avoid falling down the pyramid (nearly always fatal)
but to avoid dislodging rock and rubble onto the numerous tourists and
camel trains that visit the pyramid each day from dawn to dusk.
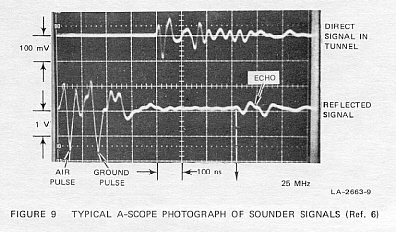
After the equipment had been placed on the north face, A-scope photographs
Were taken of the outside north-face-received signal on one channel of
the scope and signals from the antenna on the north interior wall of Belzoni's
chamber on the second scope channel. Typically, the A-scope signals received
are as shown in Figure 9. The scope was located in Belzoni's chamber. In
spite of the high noise levels on the outside (north-face) receiver, a
weak echo at 700 ns (nanoseconds) and a stronger echo at about 1100 ns
could be seen on the A-scope. At first it was felt that one of these echoes
was a return from Belzoni's chamber, or the lower chamber, or an entrance
passageway; however, delay-time and signal amplitude of the one-way signals
received inside Belzoni's chamber were grossly inconsistent for a path
in rock of approximately 82 m. (The one-way and two-way propagation times
expected for 82 m of rock are 807 and 1614 ns, respectively.) More careful
checking established the fact that the signals received in Belzoni's chamber
were propagated into the chamber down the shield of the coaxial cable connecting
the outside (north-face) receiver to the oscilloscope in the chamber. In
fact, the observed propagation delay of the signal corresponded closely
to the actual length of the coaxial cable connecting the scope to the outside
antenna.*
In spite of the disconcerting fact that no signals appeared to be coming
one-way through the rock from the transmitter on the north face into Belzoni's
chamber, the presence of one and possibly two echoes seen on the oscilloscope
from the exterior receiver had to be accounted for. Therefore, the transmitter
and receiver were next relocated 32 m and again, 76 m, up the side of the
north face from the base to see if the observed echoes changed character
or position. When the equipment was emplaced 32 m up the north face, the
observed main echo decreased in range to 520 ns, equivalent to 140 m distance
in air (or 44 m in rock of dielectric constant 10). Other weak, more questionable
echoes could be seen at 600, 700, and 1200 ns when local noise levels subsided
for brief periods. When the sounder was located high up on the north face
(76 m from the base sloping distance), the observed "main" echo increased
in range to 1250 ns and no other echoes could be seen.
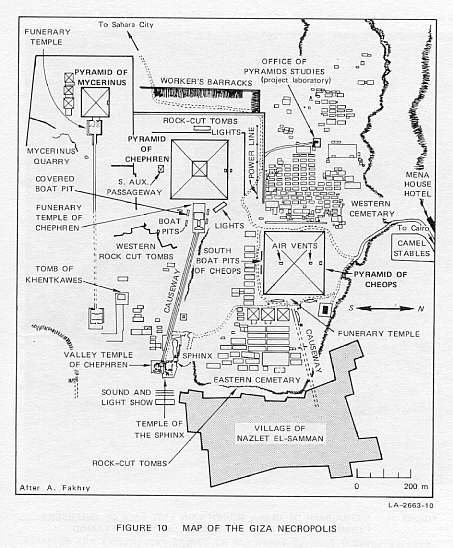
An examination of the map of the Giza necropolis (Figure 10) shows that
the most likely explanation for the observed "north-face" echoes was that
all of them arose through the air from targets in the Giza area and not
from targets within the pyramid. While the sounder antennas couple energy
poorly into air compared to rock, even 30 or 60 dB of antenna inefficiency
for air-propagated signals is small compared to 100 dB or more of attenuative
loss in the rock over a few tens of meters distance. It is our conclusion
that the principal echo observed on the north face was a reflection from
the power line running east and west along the main road 110 m north of
the base of Chephren's pyramid. The other weaker echoes appear to arise
from scattering from the pyramid pavement areas and cliffsides north of
the pyramid.
By relocating the transmitter on at least one face of Chephren's pyramid
other than the north (away from the entrance passageways), the team felt
it could be more certain that any signals received in the interior were
propagating through the rock faces rather than spuriously down a power
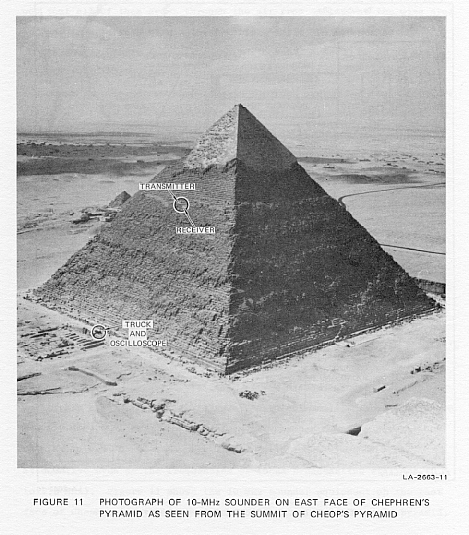
line or communication cable. The conclusion of two such experiments--one
on the east and one on the south face--was that at no time could 1.2-MW
transmissions of 10-MHz pulses be detected in Belzoni's chamber through
the approximately 80 m of the limestone blocks, rubble, and mortar of the
pyramid. In fact, it was also concluded that the relatively high RF noise
levels observed in Belzoni's chamber at HF were largely due to signals
conducted into the chamber down the power lines running in and out of the
pyramid--the walls were evidently highly attenuative even at the frequencies
of local broadcasting stations (0.5 to 1.5 MHz). Figure 11 shows the 10-MHz
sounder equipment on the east face of Chephren's pyramid as seen from the
summit of Cheops' pyramid.
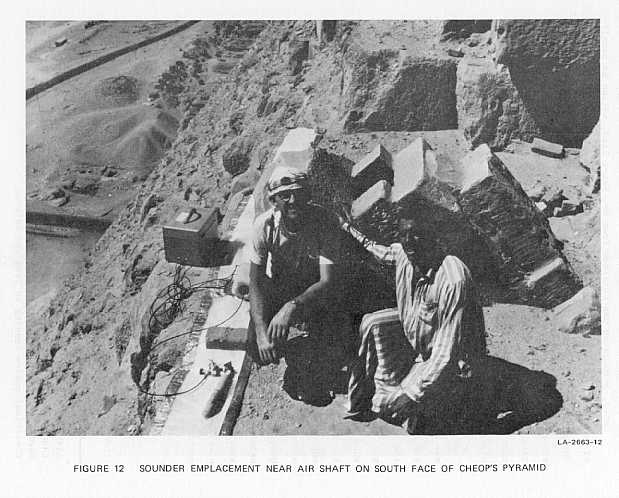
Later, permission was obtained from Dr. Henri Riad, acting on behalf
of Dr. Gamal Mokhtar, to study the first and third pyramids also, in order
to determine the uniformity of RF losses elsewhere at Giza. A simple and
effective experiment on the pyramid of Cheops required only a few hours'
time, yet was quite conclusive. The 10-MHz transmitter and antenna were
carried 100 m up the south face of Cheops' pyramid (Figure 12), and placed
by the air shaft from the King's chamber (Figure 13).
With our transmitter operating, a short-wave portable radio receiver
was hand-carried around the base of Cheops' pyramid to the north face and
into the chambers through Al Mamun's entrance. A few meters past the entrance
portal, all signals from the sounder had disappeared as well as the short-wave
broadcasting stations of similar frequency. Even when the receiving antenna
in the portable receiver was placed next to the air shaft on the south
wall of the King's chamber, no sounder signals could be heard through the
intervening 50 m of rock. Qualitative checks of local broadcast stations
(1 to 2 MHz) were also made in the King's and Queen's chambers and the
Grand Gallery of the Great Pyramid (Cheops'), using the portable receiver.
Only the very strongest Cairo broadcasting stations could be heard in the
presence of noise.* Because the incoming electric
power wiring in the Great Pyramid is imbedded in the walls and partially
shielded, it was apparent that little, if any, of the broadcast station
energy was propagated down these cables.* Thus,
very high RF losses were also found to exist in Cheops' pyramid. The limestones
of both of these major Giza pyramids were conclusively shown to have high
radio-frequency losses.
As mentioned, experiments with the sounder placed on the east and south
faces of Chephren's pyramid had established that attenuative losses in
the walls of the second pyramid were too high to permit receiving a 10-MHz,
1.2-MW signal in Belzoni's chamber. Therefore, no echoes from within the
pyramid itself were to be expected unless the pyramid was a very nonhomogeneous
dielectric. If such were the case, one might conceivably obtain scattering
echoes from the specular point on the opposite cap, as indicated in Figure
14. On the east and south faces, several weak echoes were seen--all apparently
from air-propagated signals scattered from the pavement and surrounding
objects such as mortuary temple walls and dislodged blocks lying on the
ground on the pavements.
On the west side of Chephren's pyramid, receiver noise levels were unusually
low and a plethora of echoes were seen. The sounder was located about 100
m up the west face. A typical A-scope photograph is shown in Figure 15.
While it is tempting to hypothesize chambers, voids, or passages within
the pyramid to account for at least some of these reflections, they can
all probably be explained as air-propagated signals scattered from numerous
blocks on the ground, the metal cover of the Sound-and-Light-Show light
bank, and the 5-m vertical bedrock face to the west of the pyramid (Figure
10). One cannot rule out the possibility of some clutter or discrete echoes
originating in and propagating through the surface layers of the pyramid,
since RF losses may be lower in the surface layers than in the interior;
however, it was felt by the team that little useful information was to
be gleaned from attempts to isolate and identify every one of the echoes
in the short time available. Antenna polarizations were changed from horizontal
to vertical, but it was impossible to relocate the sounder either higher
or lower on the west face to correlate observed echoes with sounder position
because of the dangerous, unsafe condition of the west face.

Since a 1.2-MW, 10-MHz signal could not be detected through the approximately
80 m of limestone to Belzoni's chamber from an outside face, the sounder
was next located on the first course of the north face of the pyramid,
just west of the entrance (Figure 16). Figure 7 shows that this is the
shortest available propagation path between the surface and an interior
chamber. Receiving equipment was placed in the lower chamber to search
for signals propagated through the intervening 32 m. All of the weak signals
observed within the lower chamber were found to be reradiated signals from
the electric lighting cables in the pyramid. This was established by moving
the sounder an equal distance east of the entrance and noting the lack
of amplitude differences of signals in the lower chamber over a longer
path length in rock. Failure to observe a detectable 10-MHz radiation through
32 m of bedrock limestone implies that the attenuative loss in the bedrock
was greater than 4.6 dB/m. Because no shorter path in rock could be found
in Chephren's pyramid, team efforts were now entirely directed elsewhere
to establish the one-way propagation losses over paths in rock shorter
than 20 or 30 m.

To the west of Chephren's pyramids is a vertical cliff five to thirty
feet high in which numerous tombs for nobles were cut when the pyramid
was built. Many of these tombs are open and accessible so that varying
thicknesses of rock could be obtained by locating the sounder on the top
of the cliff and a receiving antenna against the ceilings of tombs beneath.
In spite of all precautions, however, several days of attempts to measure
attenuation through approximately one foot of limestone roof were inconclusive
because the actual propagation paths could not be established conclusively.
Next, efforts at short-path attenuation measurements were concentrated
at a sloping passageway and pit in bedrock located just south of Chephren's
pyramid (Figure 17). By emplacing a receiving antenna against the sloping
ceiling of the entranceway and the transmitting and a second receiving
antenna along grid lines on the surface, it was hoped that attenuation
versus thickness of limestone could be measured. Again, results were inconclusive--propagation
modes could not be clearly identified without ambiguities. At this point,
the team divided into two groups--one studying a known, covered boat pit
east of Chephren's pyramid and the second, the interior passageways of
the third pyramid--that of Mycerinus. These experiments are discussed in
Chapters III and IV.
III. FIELD EXPERIMENTS AT GIZA: PROPAGATION MEASUREMENTS
AT THE PYRAMID OF MYCERINUS
A. Introduction
The discovery that propagation conditions in Giza limestone do not permit
sounding of Chephren's pyramid in accordance with the original plan for
the project raised the immediate question of establishing the precise rather
than the qualitative propagation properties of Giza limestone. The team
was led to a search for a suitable place to make accurate measurements
of the propagation parameters of the rocks at Giza and for places to attempt
to obtain echoes from known shallow targets. The search included experiments
at a number of sites; a boat pit east of Chephren's pyramid, the remains
of a sloping passage leading to a pit to the south, and tombs in the cliff
to the west of the same pyramid. Tests at all of these sites were largely
inconclusive or negative. The best site found for such measurements was
the vertically separated corridors in the pyramid of Mycerinus (Figure
18). The geometry of a cross section of these corridors is shown in Figure
19. Measurements between these two corridors were made by locating the
transmitter on the floor of the upper corridor and receiving antenna flat
against the roof of the lower corridor. Timing was taken from a second
receiving antenna adjacent to the transmitting antenna.
The advantage of this geometry is that it is possible to run experiments
in which the transmission time through the air between transmitting and
receiving antennas is much larger than the direct transmission time through
the rock. Where such a geometry is lacking, it can be quite difficult to
identify signals propagated through the rock. In addition, signals arriving
by paths other than the one desired represent measurement noise (clutter).
In the worst cases, they can obscure the desired signals entirely.
The corridor geometry in Mycerinus avoids the timing problems very effectively,
however. When the transmitter and receiver are both 14 ft from the chamber,
the shortest path around the end of the corridors through the air requires
32 ns at the speed of light. The direct path through the rock takes only
about 12 ns, so there should be no spurious signals for at least 20 ns
after the onset of the signal through the rock.
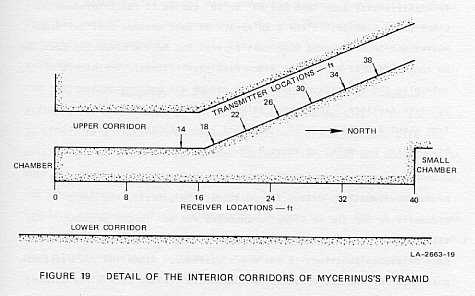
At the other extreme, if the transmitter and receiver are both located
38 ft from the ends of the corridors, then the air path requires at least
80 ns. The direct path through the rock is 12.5 ft long, and requires only
about 40 ns. There is, however, a possibility that signals can reach the
roof of the small chamber in the lower corridor and propagate through the
air to the antenna by a path that is somewhat shorter than 80 ns. The actual
received signals appear to be clean for at least 25 ns.
The measurement of transmitter and receiver locations along the corridors
from the chamber at the common end was quite straightforward and accurate.
The surveying equipment we had did not permit an extremely accurate survey
in the cramped quarters of the corridors, however. Thus, we have been forced
to assume that the apparently level portions of the two corridors are parallel.
A crude survey of the angle of inclination in the upper corridor yielded
a value of 23°. This figure is significantly
less than the 25° or 26°
quoted in the literature for other polar passages in the Giza area. We
have assumed that our crude survey was less accurate than past surveys
and have arbitrarily assigned an inclination of 25°
in the discussion that follows. The effect of retaining the 23°
figure would be to reduce the maximum transmitter to receiver distance.
This would raise the apparent dielectric constant from about 8.75 to about
10. It would also increase the calculated attenuation per meter by about
3 dB.
Measurements were made in these corridors using both spark and avalanche-transistor-driven
transmitters. In general, the spark transmitters operate at lower frequencies
and use larger antennas. For this reason, it was impossible to position
the transmitting antennas at many different positions in the upper corridor.
Since the few available positions for the low-frequency measurements yielded
only a few points, the interpretation of these measurements is not considered
very reliable. However, smaller antennas made a much more extensive measurement
program feasible at nominal frequencies of 50 MHz and 150 MHz. The excellent
results obtained in these measurements will be described in the sections
immediately following, and the results of the lower-frequency measurements
are described in Section F of this chapter.
B. 50-MHz Measurements
All of the measurements in the corridors of the third pyramid followed
a similar pattern regarding equipment placement. The transmitter and an
antenna to provide a timing reference were both located on the floor of
the upper corridor. When the transmitter was moved to a new location, the
upper-corridor receiving antenna was moved along with it to keep the propagation
time to the reference antenna constant. The reference antenna also served
as a receiving antenna for possible echoes from the roof of the lower corridor.
The receiving antenna for one-way propagation measurements was held flat
against the roof of the lower corridor by a large piece of styrofoam supported
by wooden poles.
The unique geometry of the two corridors provided an excellent differential
measurement of the pulse propagation properties of the stone in situ. In
a differential measurement, the signals received with the transmitter and
receiver in various different locations are compared with each other. In
this way, such factors as the absolute power radiated by the transmitter,
the collecting area of the receiving antenna, and the coupling efficiency
of the antennas to the rock do not affect the outcome of the experiment
because they are held constant. While there undoubtedly were slight variations
in coupling efficiency due to surface variations at the different sites,
these variations are much smaller than the uncertainty in the absolute
value of any of the radiative parameters.
Two conceptual plans for a differential propagation measurement were
permitted by the sloping corridor geometry. The simpler plan was to locate
the transmitter and move only the receiver to vary the distance between
them. A somewhat more complicated operation consists of moving both the
transmitter and receiver so that the measurement is always made on an essentially
vertical path.
As the figures in this section illustrate, the two measurements differed
in one important aspect. The measurement along a vertical path is always
made over the path of least travel time between the transmitter and receiver.
The first signal to arrive at the receiver is thus surely the signal that
has traveled the entire distance through the rock. If an oblique path is
chosen, as when the receiving antenna only is moved, then the path of shortest
travel time is a combination of the vertical path through the rock and
a horizontal path through the air. This mixed-path signal arrives first
at the receiving antenna because the propagation velocity in the rock is
slower than that in the air. It makes identification of the direct-path
signal through the rock difficult or impossible.
Measurements of both types were made with the 50-MHz equipment. In one
series of measurements, the transmitter remained at the 14-ft location
while the receiver was moved. In the second series, the transmitter was
stationed at the locations indicated in the upper corridor in Figure 19,
with the receiver placed each time in three locations approximately below
the transmitter point.
Figure 20 shows two A-scope displays of the received signals. The upper
trace is the signal received on the test antenna in the lower corridor.
The lower trace is a reference signal obtained from the receiving antenna
that was kept about 5-ft from the transmitting antenna. The latter signal
makes it possible to measure the propagation velocity along with the attenuation.
As the reference antenna was moved up the corridor, it was necessary at
one point to add another cable length to reach the oscilloscope. Oscilloscope
photographs were made with both cables to maintain time calibration. This
change obscures a 30-ns time shift between the two parts of Figure 20.
The amplitude of the signal received on the lower-corridor antenna was
scaled using only the first half-cycle of the received signal. The scaled
amplitudes were then compensated for the effects of spreading loss and
an assumed antenna directional pattern. The spreading-loss compensation
assumes that the field strength would vary inversely with the distance
between the transmitting and receiving antennas if there were no attenuation
caused by the rock. The compensation for antenna directivity assumes that
the antenna patterns closely approximate a simple dipole--i.e., that the
sensitivity varies as the cosine of the off-perpendicular angle. The compensation
due to angles is only about 5% for the points on the near-vertical path,
but it is more important when the receiving antenna is moved off to large
oblique angles.
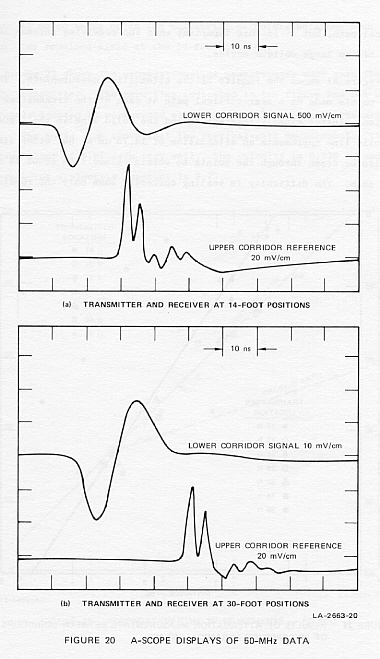
Figure 21 shows the results of the attenuation measurements. The three
points made on a near-vertical path at each of the transmitter locations
cluster closely together around the solid line in the figure. The solid
line represents an attenuation of 14.75 dB/m, but other lines can also
be drawn through the points to obtain values from about 14 dB/m to 17 dB/m.
The difficulty in scaling correctly when only the receiving antenna is
moved shows up in the scattering of points obtained when the transmitter
remained fixed at the 14-foot station.
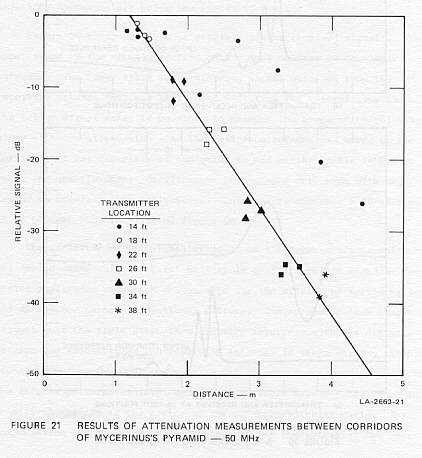
Figure 22 shows the propagation-time measurements made with the 50-MHz
transmitter. The zero time indicated in the figure has not been accurately
located to correspond with the onset time of the transmitted pulse. The
solid line shows that the vertical-path measurements fit a constant slope
of 9.87 ns/m very well. The velocity is 0.338 c, and the corresponding
dielectric constant is 8.77.
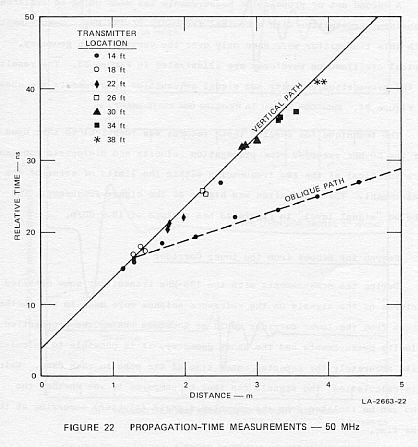
The dashed line in Figure 22 has a slope equal to the velocity of light
and is a rather good fit to the oblique path measurements made when the
transmitter was fixed at the 14-ft station. This larger apparent velocity
confirms that the measured signal reached the antenna by a path consisting
of the shortest possible route through the rock and the balance of the
path in the air.
C. 125-MHz Measurements
A second set of propagation measurements was made using an avalanche-transistor
transmitter with a nominal frequency of 125 MHz. Measurements with this
transmitter were made only over the vertical path geometry. Typical oscilloscope
waveforms are illustrated in Figure 23. The results of the propagation
velocity and signal attenuation measurements are shown in Figure 24.
The technique for scaling these records was identical to that used for
the 50-MHz records. The propagation velocity and dielectric constant were
identical at the two frequencies within the limits of error of the measurement.
The attenuation was higher at the higher frequency. The labeled "signal
level" in Figure 23 has a slope of 18.2 dB/m.
D. Search for Echoes from the Lower Corridor
During the measurements with the 125-MHz transmitter some detailed pictures
of the signals on the reference antenna were made to see whether echoes
from the lower corridor could be located. Using the propagation-velocity
measurements and the known geometry, it is possible to calculate quite
accurately the expected onset time of the echo in each case. Using this
calculation, the signals can then be compared to see whether the echo can
be isolated from the unwanted signals (clutter) occurring at the same time.
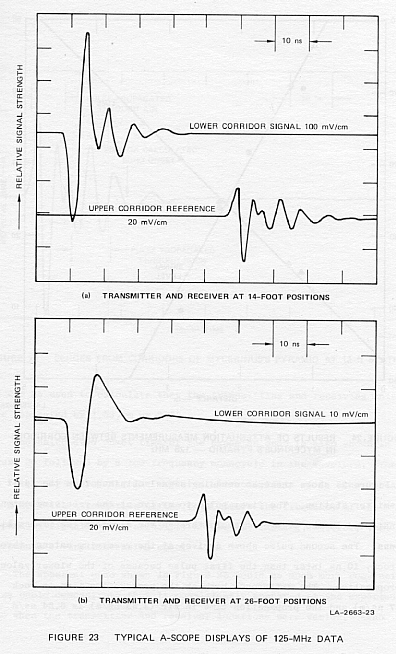

Figure 25 shows the echo sounding signal obtained from the 14-ft transmitter
station. The first pulse to arrive at the receiving antenna, as indicated
in the figure, travels through the air from the transmitting antenna. The
second pulse shown arrives at the receiving antenna through the rock, 10
ns later than the first pulse because of the slower velocity of propagation.
The difference between the propagation time in rock (9.87 ns/m) and the
propagation time in air (3.33 ns/m) is 6.54 ns/m and can be used to calculate
that the transmitting and receiving antennas were separated by 1.53, m
or 5 ft.
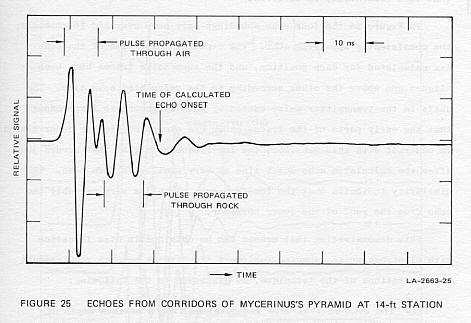
The calculated onset time of the expected echo is also shown in Figure
25 followed by a low-frequency monocycle in the waveform. The low frequency
represents the expected characteristic of an echo, because the dispersive
attenuation of the rock lowers the frequency of the propagated signals.
The signal is not so outstanding, however, that it represents a very convincing
echo.
The apparent echo shown in Figure 25 would be much more convincing if
we could demonstrate that it consistently appeared at the expected time
when the transmitter and receiver locations were varied. Echo soundings
made at four different stations can be used to demonstrate that this consistency
is observed.
In Figure 26 the four echo soundings have been overlaid to emphasize
the consistently appearing echo. The expected onset time of the echo was
calculated for each position, and the successive traces have been aligned
one above the other according to the calculated echo time. The shift in
the transmitter pulse caused by this alignment is large enough that the
early parts of the traces shown are almost completely decorrelated. In
contrast with this behavior, the low-frequency signal that occurs just
after the calculated echo onset time is very similar in each case. This
similarity indicates that the low-frequency signal is very probably the
echo from the roof of the lower corridor.
This demonstration that echoes can be obtained in Giza limestone with
electromagnetic sounding equipment illustrates several requirements and
limitations of the technique, as discussed in the following:
(1) The echo in this case was obtained from a maximum depth of 1.65
m. At this range, the echo strength is not more than 10 dB above the clutter
level for the next 20 to 40 ns. Even though it might be feasible to improve
the receiver sensitivity and overcome the resulting overload problems,
the clutter will provide the sensitivity limit. With the 36-dB/m attenuation
rate for round-trip signals, this means that the sensitivity limit will
be reached at less than 2 m depth.
(2) It is likely that the clutter consists almost entirely of air-propagated
signals. As a consequence, a rather small change in the attenuation characteristics
of the rock can make quite a large difference in the maximum possible sounding
depth.
(3) Figure 26 demonstrates the usefulness of moving the sounder and
comparing the resulting signals to separate echoes from clutter. Even better
than the quite laborious comparison made in this case is the display of
data obtained by continuously moving the sounder and obtaining a continuously
varying data display.
(4) The minimum useful echo depth is determined by the end of the transmitter
pulse propagated to the receiving antenna through the rock. With the 5-ft
antenna separation used here, the rock-propagated transmitted pulse ends
about 28 ns after the transmit-pulse initiation. Consequently, an echo
must come from a depth of at least 1.4 m if it is to be visible after the
transmit pulse. If the transmitting and receiving antennas are collocated
as nearly as possible, the rock-propagated transmit pulse will be moved
almost 15 ns earlier in time, but it will also have much larger amplitude.
Although overload of the receiver amplifier and close-in clutter may still
limit the sensitivity to close-in echoes, this calculation suggests that
echoes from objects as close as 0.7 m may possibly be delineated.

E. Transmitter Frequencies and Dispersion Effects
All references to transmitter frequencies thus far have been to nominal
frequencies of 50 MHz and 125 MHz. The reason for these vague references
is that the transmitting antenna is a part of the frequency-determining
circuit. Because it is tightly coupled to the rock, the impedance-versus-frequency
characteristic of the antenna is partly determined by the dielectric constant
and loss tangent of the rock. Thus there is no universal frequency for
a particular antenna. This characteristic is particularly important for
the avalanche-transistor transmitters. In these transmitters, a capacitor
is discharged into the antenna using the avalanche transistors as a switch.
The discharge has no characteristic frequency of its own. The oscillating
current is created entirely by the filter characteristics of the antenna.
As a general rule, the attenuation of rock becomes greater at higher
frequencies. When radio frequency signals propagate a given distance through
the rock, the higher-frequency components are attenuated more than the
lower-frequency components. The result of this frequency-selective attenuation
(dispersion) is a filtering action that makes the apparent frequency of
the radio frequency signal decrease with distance. This effect can be seen
in the data obtained in the pyramid of Mycerinus. In Figures 20 and 23,
for example, the upper waveforms oscillate at a higher frequency than the
lower.
All of the waveforms from the Mycerinus experiments have been scaled
to determine an apparent frequency by measuring the period of the first
half-cycle of the propagated signal. Figure 27 shows the results of this
scaling. While there is some scatter of the points in each case, the frequency
apparently decreases approximately linearly with the propagation distance.
This fact makes it very tempting to extrapolate the experimental data to
zero distance and assign actual frequencies of 76 MHz and 148 MHz to the
nominal 50-MHz and 125-MHz transmitters.
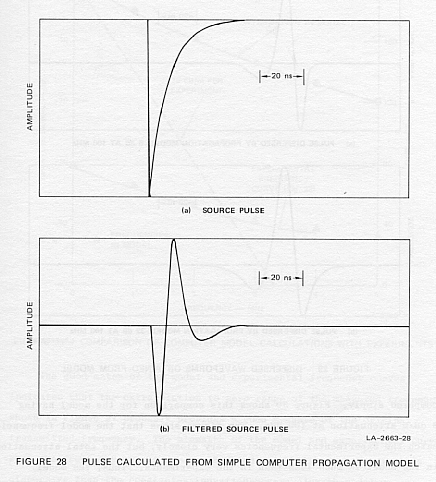
To determine whether this extrapolation makes sense, some computer calculations
were made using a simple model of the pulse-generation and propagation
process. Figure 28 shows the source pulse simulating the discharge of a
capacitor into a resistive load and the radio frequency pulse resulting
from filtering this pulse with two digital filters. The major filter determining
the pulse shape is a two-pole butterworth high-pass filter with a 40-MHz
3-dB frequency. The high-frequency cutoff set by a three pole butterworth
filter at 100 MHz affects only the initial slope.
To provide a simple model of dispersive attenuation, a constant attenuation
per wavelength was assumed. In this model, the attenuation in dB for each
frequency component is linearly proportional to frequency. For simplicity,
the model calculation modified only the amplitude of the frequency components
without varying the phase. Such a filter is not causal, and causes the
pulse to begin earlier in time than the original source pulse. In this
sense and in the simple frequency variation of the attenuation, the model
is not realistic. Yet it does preserve many of the important characteristics
of the experimental measurements.
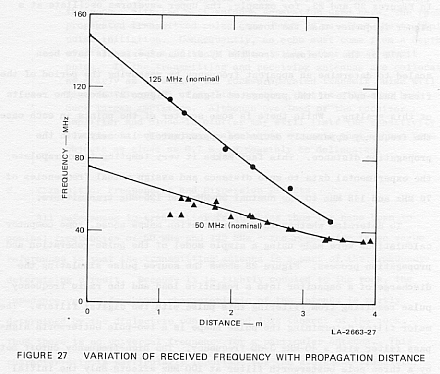
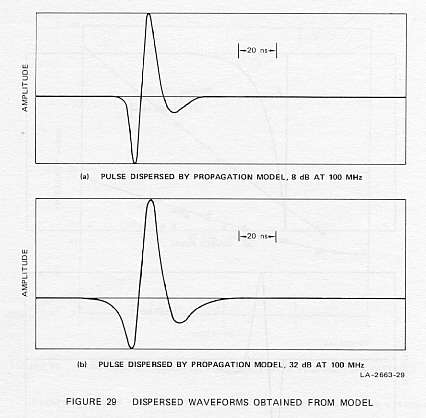
Figure 29 shows two of the dispersed waveforms. Since the attenuation
is linear with frequency, it is readily specified by indicating the value
at 100 MHz, which is 8 dB and 32 dB in the two cases shown. There is a
definite resemblance between these waveforms and those obtained in the
experiments, though the second negative excursion is somewhat too large.
The model can be further compared with the experiments if a distance
scale is assigned, rather than just the total attenuation at 100 MHz, as
is indicated in Figure 29. For example, one might assign a range of one
meter to Figure 29(a), and four meters to Figure 29(b). This generates
a model in which the attenuation is 8 dB/m at 100 MHz. Because the model
assumes that the attenuation is directly proportional to frequency, the
same model has an attenuation of only 4 dB/m at 50 MHz.
If the frequency and amplitude of the model pulses are scaled in the
same way as the experimental data, the two sets of results can be compared
simply. Figure 30 shows this comparison for the model having 8 dB/m attenuation
at 100 MHz. The figure shows that the model frequencies match the experimental
frequencies very closely, but the total attenuation in the model is much
less than in the experiments. Thus, the model reproduces very well the
dispersive frequency shifts observed, but it is too simple to match both
the dispersion and the total attenuation. If a different scale factor had
been selected for the attenuation per meter at 100 MHz, the experimental
amplitude data could have been matched, but the frequency behavior would
then have been incorrect.
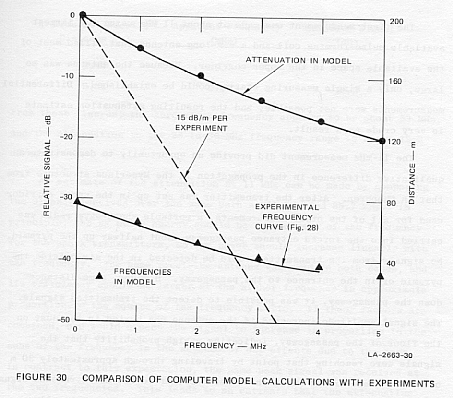
The good match of the model and experimental frequency curves indicates
that the extrapolation to zero range of the measured frequencies shown
in Figure 27 probably provides a good measure of the original transmitted
frequency. The mismatch of the model and experimental curves when the frequency
curves are matched indicates that the rock is less dispersive than the
constant-attenuation-per-wavelength model.
F. Other Measurements in the Mycerinus Corridors
Measurements were also made in corridors of Mycerinus' pyramid using
the spark-driven transmitters that were intended to sound the body of Chephren's
pyramid.
The first measurement was made at about 11 MHz using the largest available
pulse-forming coil and a 6-m-long antenna that filled most of the available
space in the upper corridor. Because the antenna was so large, only a single
measuring station could be established. Differential measurements were
not possible, and the resulting attenuation estimate is very crude as a
result.
The 11-MHz measurement did provide an opportunity to demonstrate a qualitative
difference in the propagation in the Mycerinus structure from that in Chephren.
After the transmitter was set up in the upper corridor used for all of
the other measurements, a portable short-wave radio was carried into the
forced entrance passageway about halfway up the pyramid. No signals from
the transmitter could be detected in the air outside the pyramid or in
the entrance to the passageway. However, some distance down the passageway,
it was possible to detect the transmitted signals. The signal amplitude
increased if the antenna was buried in the dust on the floor of the passageway,
indicating a high probability that the signals were reaching that point
by traveling through approximately 30 m of rock. There are no wires in
either corridor to act as extraneous signal carriers. Because part of the
forced passageway descends vertically toward the corridor where the transmitter
was located, there is a part-rock, part-air path that is shorter than the
all-rock path. The passageways are waveguides far below cutoff at 11 MHz,
however, and the stronger signal when the antenna was in the dust on the
floor supports the idea that the 11-MHz signal may have traveled between
the two corridors by a path entirely within the rock structure of the pyramid.
Measurements made with a second spark transmitter and a 3 m antenna
allowed two positions for the transmitter to be established in the upper
corridor. These two positions permit an estimate to be made of the attenuation
at a lower frequency. The data are:
| Transmit-Receive Distance (m) |
Apparent-Frequency (MHz) |
Relative Signal(dB) |
| 2.44 |
35.7 |
0 |
| 3.51 |
27.7 |
-13.2 |
From these figures, the zero-range frequency appears to be about 53
MHz, and the attenuation in the 28-to-36-MHz frequency range is about 12.3
dB/m.
An estimate of the attenuation at 11 MHz can be made by comparing the
signals received over the same path at 11 MHz and 35.7 MHz. In principle,
the RF pulse energy should be independent of the frequency for the spark
transmitters, so the power should increase linearly with the frequency.
The same receiving antenna was used in both cases, and its efficiency should
be larger at the higher frequency in approximate proportion to the square
of the frequency ratio. If these factors are combined, one would expect
the signal to increase in proportion to the cube of the frequency in the
absence of any effects due to the rock. In contrast to this expectation,
the same peak signal was received at the two frequencies. This leads to
an estimate that the attenuation was about 15 dB less at 11 MHz than at
35 MHz over the 2.44-m path, or about 6.2 dB/m. This gives an estimate
of 6.1 dB/m for the attenuation at 11 MHz.
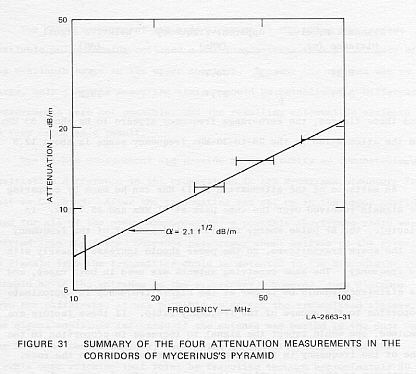
G. Summary of the Mycerinus Measurements
The attenuation measurements described in the preceding sections represent
four rather crude points on a frequency-versus-attenuation graph. In three
cases, the average attenuation over a rather large range of frequencies
has been determined, while in the fourth case a rather large error bar
must be placed on a single-frequency measurement. When these points are
plotted on a single graph, as in Figure 31, they provide an acceptable
fit to a square-root-of-frequency relationship. This conclusion agrees
well with the finding that the linear frequency relation used for the computer
model represented excessive dispersion.
We hope that in the future it may be possible to perform further analysis
of these excellent data that would lead to more definitive scientific results.
For example, it could be worthwhile to digitize the waveforms from the
oscilloscope photos and Fourier-analyze them to obtain a much better set
of curves for the attenuation-versus-frequency characteristics of the rock.
The unusual geometry of the Mycerinus corridors provided an almost unique
opportunity for making such differential measurements in situ. The measurements
made under these unique circumstances deserve a full analysis.
IV. FIELD EXPERIMENTS AT GIZA: PROPAGATION MEASUREMENTS
IN CHEPHREN'S BOAT PITS
As mentioned in Chapter I, the area in the near vicinity of the pyramids
in the Giza complex has yielded a number of archaeological finds of major
importance within the last 50 years. The discovery of two funerary boats
of Cheops (on the south side of the pyramid) in 1954, one of which has
now been completely restored, are examples of such discoveries. The pits
in which such boats were hidden in ancient times seemed to our team ideally
suited for detection by short-pulse electromagnetic sounder techniques.
The pits were hewn out of the native limestone bedrock--often in the shape
of the Pharaoh's boats--and the boats were deposited in these pits for
the Pharaohs' use in their after-life journeys. The chambers were then
covered with one or more layers of large slabs of limestone, and mortared
in place to form an airtight roof over the boats. Subsequently buried under
debris and wind-blown sand, the locations of some of the funerary boats
has remained unknown to recent times. Several more are believed to be as
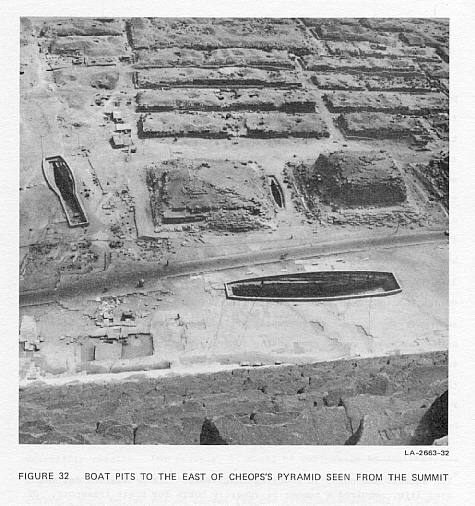
yet undiscovered in the Giza area.* A photograph
taken from the top of Cheops' pyramid, Figure 32 shows three of Cheops'
boat pits opened earlier, lying on the east side of his pyramid.
To determine the feasibility of boat-pit detection using electromagnetic
pulse echo sounding, tests were performed on a known boat pit alongside
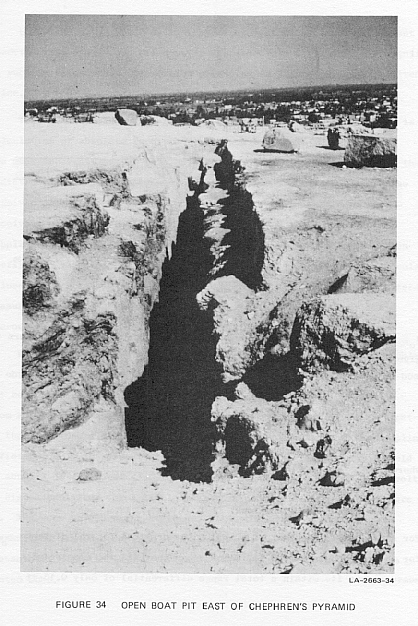
the east face of Chephren's pyramid (see Figure 33). Figure 34 shows a
very similar, adjacent boat pit (in ferruginous, badly weathered limestone),
missing its stone roof. The boat pit of Figure 33 had its entire roof structure
intact (32 inches thick), although it had been explored in ancient times
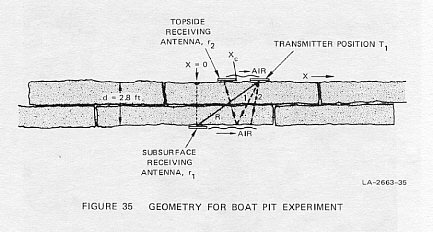
by forced entry through one end and side. The geometry of the experiment
is illustrated in Figure 35, which shows the position of the transmitter,
T1, on the surface and the receiver, r1, on the chamber
ceiling inside the boat pit. Another receiving antenna on the surface at
position r2 was used as a timing reference. Our first experiment
was to measure the one-way transmission losses through the approximately
0.8 m of limestone roof slabs at an operating frequency of 125 MHz.
The topside transmitter and receiver were moved in the "x" direction
(Figure 35), which varied the distance R to the receiver r1.
This experiment was an attempt to make a differential propagation measurement
such as those described in Chapter III. This technique eliminates many
of the uncertainties in the radar calculations, such as antenna gain, efficiency
of the coupling of the transmitting and receiving antennas to the rock,
and absolute value of the transmitted power output. The experiment suffers
from an important limitation in that it is geometry-dependent and that
affected the results in this case. When the transmitter is moved a relatively
short distance in the "x" direction (to the point xc shown in
Figure 35), the direct path through rock from transmitter to receiver is
no longer the shortest path in nanoseconds of time. Energy can arrive at
the receiver r1 via other paths such as Path 2, which is partially
through air and partially through rock. Interference begins to occur between
signals traveling partly through the air and the wanted signal traveling
directly through the rock alone. The lateral distance, xc, that
the transmitter can be moved before such interference occurs is given by
the equation
xc = d/[(er - 1)1/2]
where
er = dielectric constant
d = thickness of the rock.
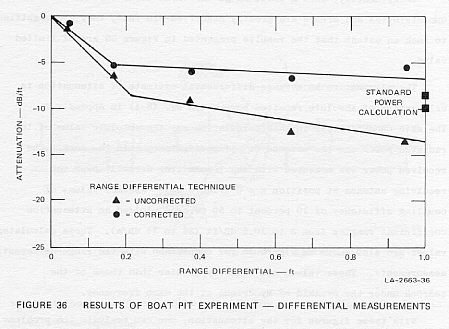
For a dielectric constant of er
= 10, the critical lateral distance xc for the case above is
0.9 ft, which means that all the meaningful measurements lie within a total
range differential of only 0.13 ft.
Unfortunately, such a small range increment means that measurement uncertainties
and errors are greatly magnified--in fact, they are magnified to such an
extent that the results presented in Figure 36 are of limited value.
The alternative to a range-differential estimate of attenuation is calculation
of absolute received power from Eq. (B-1) in Appendix B. The main uncertainties
in this calculation are the absolute value of the radiated power and the
antenna coupling efficiency into the rock. The received power was measured
with the transmitter directly over the receiving antenna at position x
= 0 (Figure 35). Assumed values of coupling efficiency of 10 percent to
50 percent yielded an attenuation coefficient ranging from 8 to 10.5 dB/ft
(26 to 34 dB/m). These calculated values are also shown in Figure 36 for
comparison with the range-differential measurements. These values are slightly
greater than those of the bedrock under the pyramid of Mycerinus at the
same frequency.
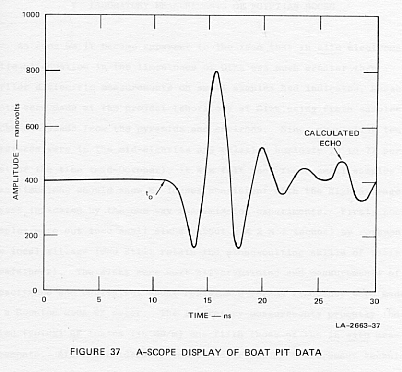
With these figures for the attenuation, one can evaluate the problems
of obtaining echoes from the boat pit. The power reflected from the boat-pit
ceiling that should be observed at receiver r2 may be calculated
from Eq. (B-2) in Appendix B. Assuming that the reflection coefficient
at the limestone/air interface is approximately 0.5, and antenna coupling
efficiency only 10 percent, the power return to the receiver, r2
should be about 3 mW (microwatts). This corresponds
to about 170 mV (millivolts) of signal amplitude, or a little less than
one scale division in Figure 37. The echo should occur at 16 ns, after
the onset of the direct transmitted signal occurring at t0,
and as can be seen, the direct transmitted pulse through air from T1
to r2 at that time obscures the wanted echo.
The conclusion based on these measurements is that electromagnetic sounder
techniques are marginally suited for locating boat pits in the Giza area
provided that the transmitter pulse length can be kept very short and the
direct air-propagated signal minimized. Because the pits are relatively
shallow, the probing pulse must be as high in frequency as losses will
allow, and the pulse length must be held to a single cycle so that any
wanted reflections do not occur within the time domain of the transmitted
pulse. A further detection aid would be a modest antenna array that would
discriminate against clutter and surface targets but would accentuate returns
from flat surfaces such as boat pit ceilings. A suitable boat pit electromagnetic
sounder should be mounted on a towable cart with a paper--chart printout
showing echoes on a depth-versus-horizontal-position display. Such a display
also aids in further discrimination between clutter and wanted echoes.
V. LABORATORY MEASUREMENTS OF EGYPTIAN ROCKS
As soon as it became apparent to the team that in situ electromagnetic
attenuation in the limestones of Giza was much greater than earlier dielectric
measurements on small samples had indicated, measurements were made at
the project laboratory at Giza using fresh samples of rocks and sands from
the pyramids and environs. Since prevailing temperatures were in the mid-eighties
and relative humidity 70 to 77 percent most of the time (mid-October),
it was felt that fresh small samples of Giza limestone should show RF losses
consistent with the high average losses indicated by the one-way transmission
experiments. First, rock samples were cut into small slabs (about 2 ×
2 × 1 inches) by workmen from the local village (who still retain
the stone-cutting skills of their forefathers). The slabs were next silver-painted
and measurements of capacitance and equivalent shunt resistance versus
frequency were made on a Boonton 250A RX meter. The laboratory measurements
promptly indicated typical RF losses (in dB/m) one-fifth those of the in
situ measurements. After considerable concern over the RX measurement
technique, the discrepancy was finally resolved by further studies at SRI's
Menlo Park Laboratory in an environmental test chamber.
This later work showed that RF losses in Giza limestones were exceptionally
sensitive to ambient relative humidity. For example, five varied samples
of limestone common at Giza were soaked in water for two hours, then allowed
to dry out naturally for several days in the Menlo Park laboratory where
the ambient temperature was »73°F
and the relative humidity, »53 percent.
RF loss at 20 MHz was measured twice a day. The very high decreases in
attenuation versus time are shown in Figure 38. Since the attenuation factor,
a,
appears as an exponent in the propagation equation (Appendix B), the attenuation
of radio waves in Giza limestone is indeed strongly dependent on local
humidity or moisture content. (Note that the vertical axis in Figure 38
is actually a log log scale.) An attenuation factor of 10 dB/m means that
one-way propagation is essentially limited (as far as sounder dynamic range
is concerned) to about 10 m, while 1 dB/m implies a useful propagation
range of about 100 m in rock. (When clutter-limited, underground electromagnetic
sounders usually are limited to a dynamic range of the order of 100 dB.)
Weight loss of the rocks was 2 percent to 9 percent during the three-day
experiment, and this gives some crude idea of the porosity of the rocks.*
Next, a collection of rock samples from Giza (as well as elsewhere in
Egypt) were cycled in a test chamber beginning from high humidity to low
at approximately constant temperature, over a period of two weeks. It was
found that most samples required about two days to reach equilibrium. Again,
the RF attenuation factor, a, was found to be
strongly sensitive to ambient relative humidity even for a change in humidity
of only 10 percent. Figures 39(a) and 39(b) show these results. Egyptian
sands and granite from Aswan showed not only low losses by comparison,
but also minimal sensitivity to ambient humidity. The environmental-chamber
data showed not only that the losses of the Giza limestones were highly
sensitive to local relative humidity, but also that the rocks were sufficiently
porous so that small samples equilibrated with the environment in a few
days' time. Evidently the rock samples lying around the surface at Giza,
selected for our Giza laboratory tests, were slightly drier than either
the bedrock or the large building blocks in which the in situ measurements
were made, and this accounted for the lower losses in the samples even
when measurements were made under Giza ambient environmental conditions.
The relative humidity at Giza is moderately high because of a prevalent,
almost year-round onshore flow of marine air from the Mediterranean; therefore,
the interior of the pyramids must be still more humid to account for the
discrepancy between the sample and in situ data.*
One of the team members, Robert Bollen, after noting the constant 83-percent
humidity in Belzoni's chamber (temperature, 85°F),
decided to measure the humidity level in Mycerinus' pyramid where no tourists
are presently permitted. He found the humidity in the Third Pyramid to
be also 83 percent. Before the Mycerinus pyramid humidity measurement,
the team had assumed the 83-percent humidity level in Belzoni's chamber
was a result of the daily influx of tourists. However, apparently the interior
of the pyramids and the bedrock are naturally very damp--83 percent relative
humidity represents probably equilibrium between the rock and the noncirculating
air of interior chambers.

At the time of the opening of the Great Pyramid by Caliph Al Mamun in
AD 820 after it had been sealed for many centuries, the interior chambers
were found "mysteriously encrusted with salt as much as one-half inch thick,"7
consistent with rock that is by nature damp and porous.
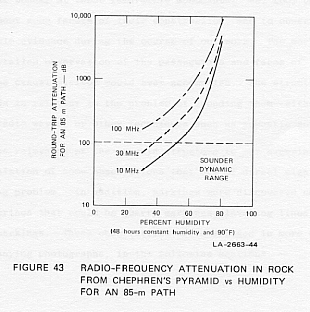
Perhaps the data shown in Figures 39(a) and 39(b) can be better understood
by replotting, and this has been done to produce Figures 40 through 43.
In Figure 40 the attenuation factor, a, for
typical Egyptian rocks is shown with respect to frequency after the rocks
were soaked 48 hours in an environmental test chamber at 90OF with 80-percent
humidity. Figure 41 emphasizes the sensitive dependence of radio-frequency
losses as a function of humidity. In this figure the attenuation per unit
wavelength in dB for typical samples, and humidity ranging from 60 to 70
percent, for Chephren's pyramid limestone, is plotted for comparison with
on-site data. Figure 42 shows the RF attenuation factor, a,
in dB per meter with respect to frequency in rocks from Chephren's pyramid
at constant temperature. Figure 43 shows the round-trip RF attenuation
in dB for an 85-m path plotted with respect to percent humidity in rocks
from Chephren's pyramid. The sounder's approximate available dynamic
range is shown by a dotted line in Figure 43, at 100 dB.

Further details concerning the mineralogy of two samples of Giza limestone
are given in Appendix C. In this appendix typical Chephren building block
limestone of good local-Giza quality is designated as "G2" and a sample
of very porous, stained limestone from a faulted area in the bedrock of
the rock-cut tombs near the northwest corner of Chephren's pyramid is designated
as "G1".
VI. OBSERVATIONS ON THE CONSTRUCTION OF THE PYRAMIDS
A. Introduction
For centuries visitors to the pyramids have wondered at the immensity
of these monuments and speculated as to the means of their construction.
The ancient Egyptians left few words or pictures to help solve this problem,
but a handful of competent scientists have managed to piece together some
of the answers from the evidence that is available in the pyramids. Unfortunately,
this work often tends to be obscured by much-publicized theories of assistance
from outer space, lost Atlantis, and other such wonders.
No less than countless other visitors, the scientists of our team felt
the wonder at these remarkable monuments. We, too, began to speculate about
some facets of their construction, and to observe some of the available
evidence during the course of our work. The work required for more detailed
observation of the passageways and faces of the pyramids than the casual
visitor would ever accomplish. The structure of the pyramids is relevant
to the problem of sounding them--either by cosmic rays, radio waves, or
other techniques such as acoustic sounding.
The relevance of the pyramid structure to our experiment leads us to
documentation of some observations that are of direct significance to the
sounding problem. In addition, markings were discovered on the pyramid
of Mycerinus that could be quarry markings, leveling lines, and survey
sight markings. These observations are discussed in more detail, with accompanying
photographs, in the following sections.
B. Irregular Blocks and Fill
The view of pyramid construction that appears most frequently in the
popular literature is that the pyramids are made of uniform, rectangular
blocks, all of which are reasonably well finished and stacked like brickwork.
While mortar is sometimes mentioned, this view leads to the impression
that there should be only small air spaces at regular intervals between
the blocks throughout the pyramid. These air spaces would be rather uniformly
spaced. They might have an effect on sounding experiments. Wavelength-sensitive
scattering might be present in radio frequency sounding, and the air spaces
might defeat acoustical sounding altogether. The air spaces would not have
much effect on the cosmic ray experiment, however, because they would represent
a very small percentage of the volume of the pyramid. However, the view
of the pyramids obtained on closer examination is quite different. Even
casual examination shows that the blocks are by no means uniform in size.
The more surprising feature, however, is the widespread use of irregular
blocks and large volumes of fill with mortar and small rocks.*
In a single sentence Edwards8 notes the use of irregular
blocks, but this hardly emphasizes the possible implications for sounding
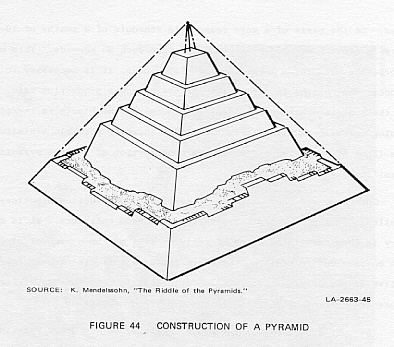
experiments. Mendelssohn9,10 has given a much more comprehensive
view of the construction of the pyramids, and the engineering reasons for
some of the construction techniques. For example, he notes carefully that
all the pyramids are constructed around a stepped core, as shown in Figure
44. Mendelssohn comments that irregular blocks cause pressure points that
can lead to structural failure in a pyramid. He stresses that while irregular
blocks and debris were used, sound "buttress" walls are required every
few meters to assure stability of the structure.
Mendelssohn concentrated his attention primarily on the engineering
developments that made it possible to build the pyramids at Giza. The use
of irregular blocks and fill at Giza suggests that the evolution of pyramid
engineering did not end with the construction of Cheops' pyramid. Rather,
the pyramids of Chephren and Mycerinus show a trend toward labor-saving
construction techniques following the construction of Cheops' pyramid.
The reasons for a desire to save labor in constructing pyramids are
not difficult to understand. If one accepts the figures that the construction
of the Great Pyramid required laying 2.3 million blocks in 20 years, then
a block must have been laid, on the average, somewhat more often that one
each five minutes, 24 hours per day for the entire period. Following this
reasoning still further, it is unlikely that the entire construction crew
worked either 24 hours per day or 12 months out of the year. On the basis
of a more reasonable schedule of 3 months of 10-hour days, a block must
have been put into place each 30 seconds. This under-scores the need for
a large labor force, because it is necessary to process many blocks in
parallel to maintain such a production rate. One of the most labor-consuming
tasks in processing the blocks is the finishing operation. Using irregular
blocks wherever possible minimizes the labor of finishing and makes the
construction of a large pyramid significantly less costly.
Core segments that provide a view of the construction practices are
available in the pyramids where there are forced entrances. It is necessary
in each case to be aware of features that may be a product of forcing the
entry. But in addition there are features that clearly are representative
of the original construction practices in these passages where there are
no finishing stones to obscure the construction.
The tourist entrance (Al Mamun's entrance) to the Great Pyramid is through
such a passage, cut only a few courses above the bedrock level. Close examination
of the passage confirms the popular notion that the construction standards
used in the pyramid of Cheops are significantly better than in the other
Giza pyramids. The first seven enormous blocks along the passageway are
rectangular and reasonably well finished. Beyond this point, however, the
standards change somewhat. Figures 45 and 46 are photographs which show
examples of the construction practices in the entrance corridor in Cheops'
pyramid.
Figure 45 shows blocks meeting at irregular angles, with mortar and
a moderate-sized rock used for fill at the joint. Figure 46 shows blocks
in the ceiling of the passageway that are rather well fitted to each other,
but not square. The long object is a fluorescent light fixture. The scale
shown in these and the figures that follow is a surveyor's tape calibrated
in feet and tenths of feet (not inches).
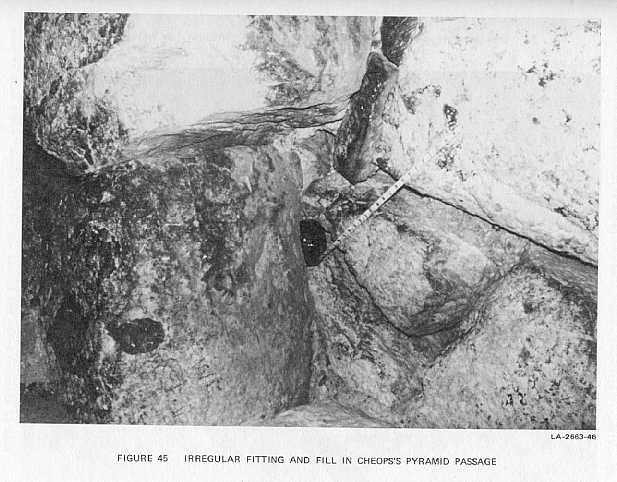
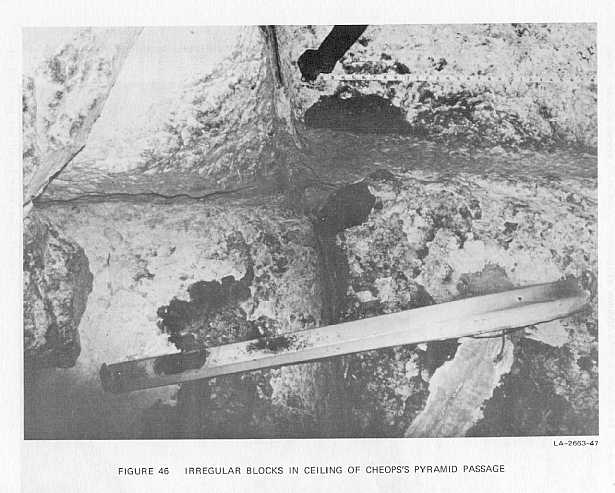
Construction standards appear to have degenerated significantly with
the construction of the second and third pyramids at Giza. It is important
to note, however, that these pyramids were stable constructions that did
not collapse as the one at Meidum apparently did.9,10 It appears
that stability was achieved in spite of the use of many irregular blocks
by using a substantial amount of mortar fill to distribute the pressure
evenly. The easiest place to observe this construction technique is in
the forced passageway in the third pyramid.
Figure 47 is an excellent example of the use of mortar fill in the third
pyramid. The lower block, on which the tape rests, has been only crudely
finished. The bottom surface of the upper block, on the other hand, is
quite flat. The mortar fill varies in thickness from about 8.5 to over
12 cm. Certainly, there was no attempt in this case to use careful fitting
to avoid the pressure points that can cause structural failure.
The flat lower surface of the upper block appears to be a universal
characteristic of the irregular blocks in the third pyramid. The need for
the flat lower surfaces is simply explained by supposing that the blocks
were moved on rollers for part of their route from the quarry to the pyramid.
Rollers require a minimum standard of flatness for the bottom surfaces
of the blocks.
The large amount, of mortar and other debris used for fill in the Chephren
and Mycerinus pyramids, coupled with the flat-bottomed rocks, suggests
another aspect of the construction technique. Irregular tops on the construction
blocks make a very poor surface for rolling the next layer of blocks into
place. If a layer is first filled with mortar and other debris, however,
the top can then be watered and smoothed to provide a good surface for
placing the next layer of blocks.
It thus appears that irregular blocks and a lot of fill have been used
to save labor, especially in the second and third pyramids at Giza. The
labor saving effected in this way would be considerable, because the task
of careful measurement and fast finishing or trimming required otherwise
is a major part of the labor requirement in placing finished blocks.
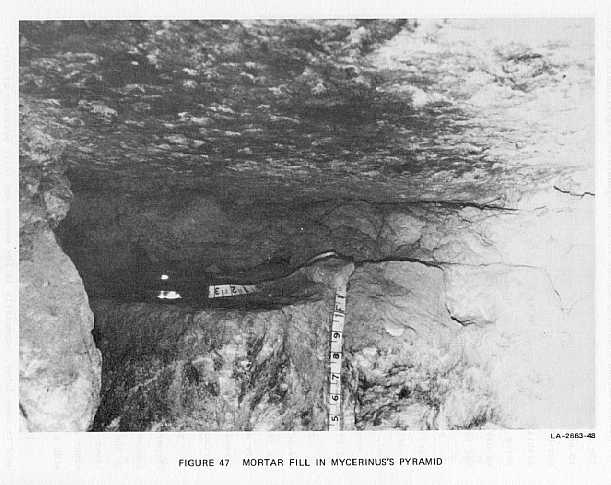
Observations of Chephren's pyramid in the passageway within the bedrock
leading to Belzoni's chamber show that there is a section of approximately
40 ft where the walls, floor, and ceiling of the foundational structure
have been replaced with limestone blocks. Upon observation of the exterior
bedrock at the east side of the pyramid, it can be seen that the bedrock
in this area is of inferior quality, and is faulted and mineralized, so
as to make the foundational structure brittle. This faulted region appears
to emerge again in the rock-cut tomb area near the northwest corner of
the pyramid. Perhaps this is why the 40-ft portion of the tunnel was replaced
with good quality limestone blocks. The faulted zone may also have an important
effect on the propagation of radio signals between the two chambers in
Chephren's pyramid.
The debris and mortar have a significant bearing on radio sounding.
Even where the rock has relatively good radio properties, the mortar is
made from gypsum and sand and has been determined to be relatively lossy.
In addition, the volumes of fill are not necessarily small with respect
to the radio-frequency wavelengths and therefore would contribute more
than originally expected to the unwanted clutter background scattering,
even if the basic rock were low loss.
The fill between the rocks also has a bearing on the potential for acoustic
sounding of the pyramids. Because the interstices between the rocks are
mostly filled with mortar, rather than air spaces, the potential for acoustic
sounding looks better than one might have thought in the absence of a detailed
study of the pyramid structure. The block structure of the pyramids still
represents a propagating medium with a large amount of built-in, unwanted
scattering, however.
C. Newly Observed Markings on the Third Pyramid
During the course of our exploration and measurements in the pyramid
of Mycerinus, a number of markings in dark red paint were noted in the
forced entrance area. They appear to be both quarry marks and surveying
indications used in placing the sloping pyramid on the outside of a step
pyramid core.
Figure 48 shows the north and east side of the Mycerinus pyramid as
seen from the top of the Chephren pyramid. The enormous excavation in the
side of the pyramid contains the forced passageway, which does not connect
with the pyramid chambers. The top of one of the interior stepped "buttress"
walls can be seen clearly in the photograph, extending almost to the top
of the excavation. A portion of the wall of the next lower step is exposed
in the bottom of the excavation. (Compare Figure 44.)
The excavation shown in Figure 48 was made in 1215 AD, and most of the
markings that were exposed at that time have been lost to weathering in
the ensuing 760 years. However, the bottom of the excavation was left covered
with the debris hauled out in cutting the passageway into the interior
of the pyramid. Approximately 2 m of debris covered the exposed portion
of the lower part of the stepped wall, protecting a number of markings
that were painted on it. The debris was cleared in 19671 under
the supervision of Dr. Ali Hassan, but the markings were apparently not
noticed at that time. In 1968 A. Hassan,11 excavating on the
fifth course of the granite outer casing, found a hieroglyphic inscription
carved in rock and including the name of Mycerinus three times. This is
the first time such an inscription has been found on the outer casing of
a Giza pyramid. Figure 49 shows the top of the exposed stepped wall. The
line separating the light and dark colored rock indicates the depth of
the debris that was cleared.
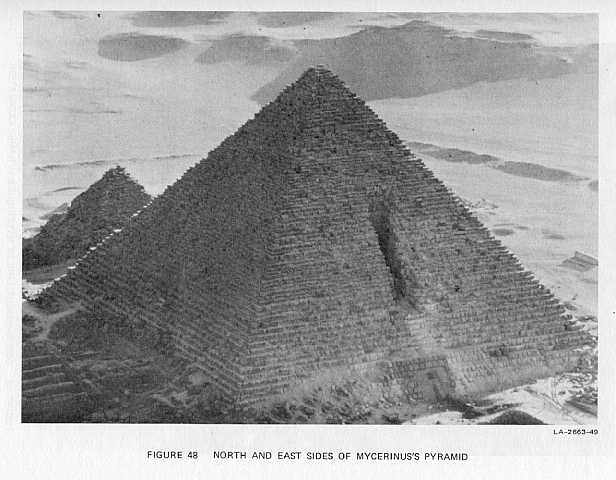
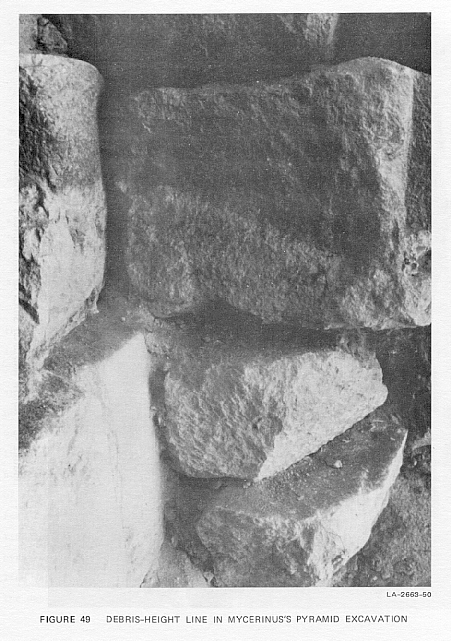 49
49
Figure 50 shows the exposed top of the lower stepped wall and the forced
entrance at the bottom of the excavation. Figure 51 is a close-up photograph
of the exposed wall after it was cleaned carefully to expose all of the
markings. The markings are quite faint, and some are difficult to see in
the reproduced photograph.
The horizontal lines covering several blocks are suggestive of leveling
lines used as aids in placing the blocks laid on the outside of the interior
stepped walls to complete the true pyramid. These marks were made after
the blocks were in place, as indicated by the fact that the marks are painted
on the mortar between the blocks, as well as on the blocks themselves.
One of the figures on the wall is very suggestive of a surveying sight.
Another suggests the alignment of the entrance. The "4" under the overhang
at the lower center appears to be a pointer to indicate that the leveling
line is on the underside of the overhang. This provides an indication that
the blocks on the outside of the interior stepped walls were never carefully
finished.
In addition to the markings on the stepped wall, two quarry markings
were found in other nearby locations. We noticed the one shown in Figure
52 in a dark corner off the forced passageway in the very weak light filtered
in from the entrance. Better lighting disclosed this clear marking on a
quite irregular block that appears to have broken because of structural
stress. We cannot determine, of course, whether the rock broke before or
after the passageway was forced nearby. However, the marking is in an alcove
that may have a volume approaching 1 m3. There is no evidence
of mortar covering the marking on the rock, and it seems unlikely that
the passage builders would have taken the trouble to clear such an alcove.
The alcove may be a place that was never filled with debris, and the rather
large hole resulting may have been a factor in the failure of the rock.
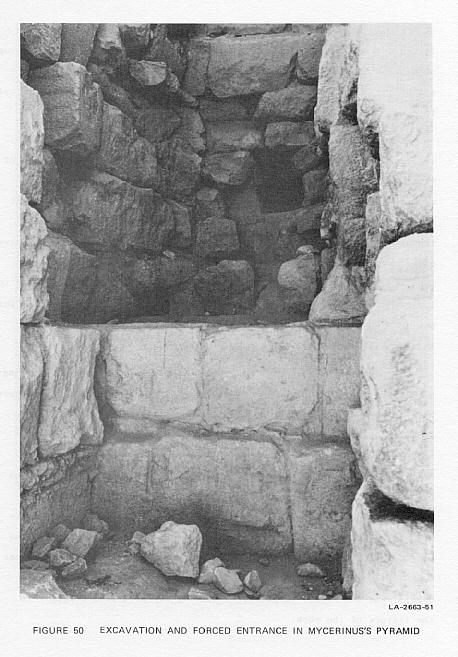
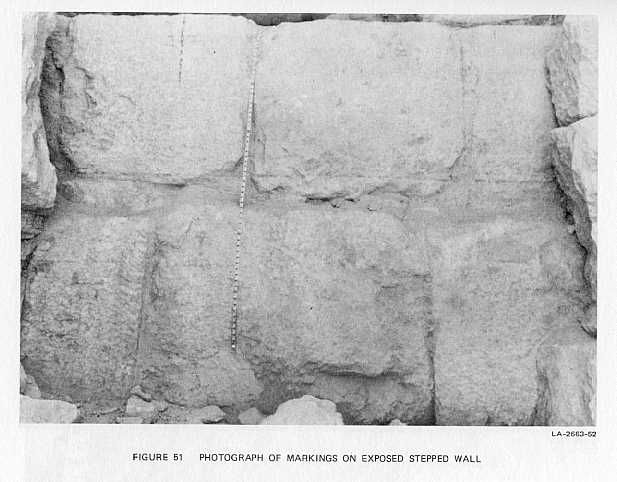
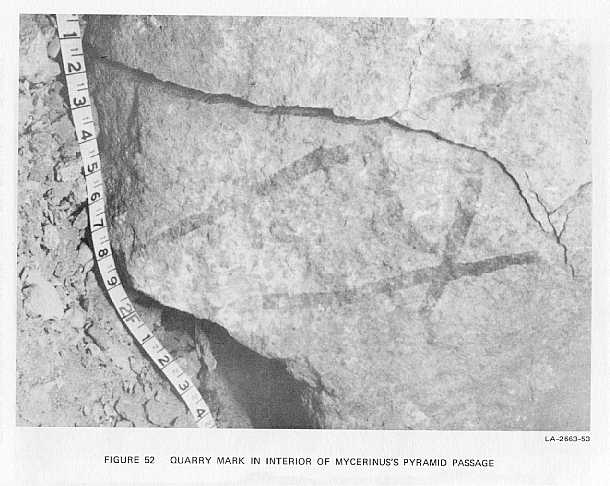

The quarry marks shown in Figure 53 were found on the east wall of the
Mycerinus excavation, just to the left of the part visible in Figure 48.
An on-the-spot interpretation (by A. Hassan) indicated that the rock came
from a quarry away from the Giza area.
These markings were discovered very late in our work in Egypt. Time
did not permit the very complete documentation that might aid in understanding
the significance of the construction markings. For example, the alignment
of the bull's-eye cross and the apparent door indication should be checked
against the actual location of the pyramid centerline and the original
entranceway.
VII. SUMMARY AND RECOMMENDATIONS
During its autumn 1974 electromagnetic sounder experiments the joint
Egyptian-American research team established that high attenuation due to
high water content in the limestone of the Giza area precluded many practical
applications of radio-frequency sounding for archaeological purposes in
that area. This finding was contrary to expectations based on laboratory
analyses of samples from the area prior to the trip. In the laboratory
tests, high attenuation and sensitivity to humidity were found in only
one of three samples sent to us from Egypt.
The samples tested before the trip apparently were not entirely typical
of the Giza area. Measurements made on the Giza area rocks in situ
showed that the attenuation varied from about 6 dB/m at 10 MHz to about
25 dB/m at 150 MHz in approximate proportion to the square root of the
test frequency. There was general agreement between the in situ
measurements and subsequent laboratory measurements of limestone samples
from the Giza area made at a relative humidity close to that inside the
pyramid chambers (around 80 percent).
Echoes were obtained on one occasion through about 1.6 m of limestone.
Success in obtaining echoes on this particular occasion does not indicate
too much practical utility of the RF sounding technique in locating unknown
chambers because the range of depths that can be probed successfully at
any sounder frequency is very limited. If a chamber were known to be at
a certain depth--e.g., 2 m--then it might be possible to select a frequency
to detect the echo. An error of 0.5 m in estimating the depth, however,
probably would cause the echo to be lost either in the strong direct pulse
from the transmitter or through attenuation leading to an echo weaker than
unwanted clutter signals.
Exploration of the pyramids in conjunction with the experiments yielded
two interesting results. The first was the discovery of several ancient
marks on the recently uncovered stepped construction of the pyramid of
Mycerinus and in the forced passage nearby. These marks include both quarry
marks and what appear to be alignment markings used as a guide in the building
of the finished pyramid.
Second, observation of construction practices showed that irregular
blocks and debris fill were used far more, particularly in the pyramids
of Chephren and Mycerinus, than we thought prior to working at Giza. While
such construction practices have been recognized by some Egyptologists,
they had not been emphasized enough for their relevance in various types
of sounding experiments to be recognized.
The recovery of more priceless Egyptian antiquities, let alone the even
more important knowledge yet to be gained concerning ancient Egypt civilization,
deserves the time, attention, and latest skills of modern science. Yet
most archaeology in Egypt continues without benefit of some of the latest
scientific techniques. There is often little to guide the archaeologist
in his choice of digging sites, and wide-scale surveys of many areas have
yet to be made.
For these reasons we are convinced that other suitable remote-sensing
instruments can and should be employed to assist the archaeologist in Egypt.
(For example, the use of the electromagnetic sounder is believed to be
feasible when probing the desert sands that overlay such sites as Saqqara.)
Additional techniques now under study include:
Pulse-echo sonics sounding
Scanning infrared imagery
Magnetometry
Microgravimetrics
Resistivity survey
Induced polarization probing
Magnetic induction probing
It is our recommendation that some or all of these modern techniques
be
pressed into the service of archaeology, especially in Egypt.
Appendix A
ELECTROMAGNETIC SOUNDER EQUIPMENT FOR PROBING THE PYRAMIDS
The Radio Physics Laboratory of SRI has been concerned since 1960 with
the application of spark switching techniques to the generation of very-high-power
impulses.12 Numerous novel transmitters using spark switching
have been developed covering the frequency range from 5 MHz to about 150
MHz, and ranging in peak power output from a few kilowatts to more than
50 MW. Many of these transmitters have been used successfully in experimental
sounders for ionospheric propagation studies, satellite calibration, and
the like.
In March 1972, SRI began an internally sponsored research and development
program to explore the possible application of the spark-switched transmitters
to underground electromagnetic sounding. Particular attention was directed
toward using the high power of the spark-switched transmitters to make
possible high-resolution electromagnetic probing to greater depths than
achieved by most currently available systems. Even these larger ranges
are very small by conventional radar standards, however, and it was necessary
to overcome three major problems to produce a working system:
(1) The transmitted pulse had to be very short and free from long-term
decay transients (which is the same as requiring the transmitter and antenna
to possess large inherent bandwidth).
(2) The receiver had to be either well isolated from the transmitter
to prevent overload, or have exceptionally good overload recovery characteristics.
(3) Transmitting and receiving antennas must couple energy efficiently
into the earth, both to improve system efficiency and to avoid as much
as possible spurious echoes received through the air from objects on the
surface.
Selection of the operating frequency for an underground sounding system
demands compromises, depending on the particular problem of interest. Because
rocks and soil in general attenuate high frequencies more severely than
low frequencies, low-frequency signals are indicated for best performance
if one wishes to locate scatterers at great depth. The use of low frequencies
implies a system with limited bandwidth and, therefore, limited resolution,
so that the range to the echo source will be poorly defined. Objects such
as underground chambers in a pyramid can also be expected to have smaller
scattering cross section at lower frequencies, as shown in Appendix B in
a discussion of specular scattering from a hypothetical chamber roof.
Several American research organizations have attempted to solve the
frequency-selection problem by generating short, unipolar pulses. Such
pulses have maximum energy at low frequencies where reasonably small antennas
are also notably ineffective. We wanted to radiate a true radio-frequency
pulse, with the peak of the spectrum at a useful sounder frequency, such
as 25 MHz. Typical spark-switched transmitters built at SRI in the past
generate such pulses by discharging energy stored in a resonant circuit
tuned to the desired frequency. The resulting output pulse represents the
combined transient response of the transmitter and antenna, and is characterized
by an exponentially decaying envelope following the largest-amplitude part
of the impulse. This envelope represents a serious hazard for detecting
scattering surfaces close to the sounder. For example, a system with a
Q as low as two requires 4.4 cycles to decay by 60 dB from peak amplitude.
At 25 MHz, or 40 ns per cycle, the time required for the pulse to reach
peak amplitude and decay by 60 ns must almost certainly exceed 200 ns with
this kind of transmitter. If the dielectric constant of the rock is ten,
this implies that one is unlikely to see objects closer to the sounder
than about 30 ft.
To overcome the difficulty imposed by the exponential decay of resonant
circuits, SRI built a transmitter based on the design suggested by Hellar
and Holter,13 and Samsel.14 This transmitter delivers
a single-cycle radio-frequency oscillation to a matched load, with virtually
no subsequent ringing. Figure A-1 is a schematic diagram of the sounder.
As finally configured, three sounders were built capable of 2 kW, 100 kW,
and 1.2 MW peak power output. In the case of the 2-kW, low-power unit,
avalanche transistors are used in place of the pressurized spark gap.
Because the exponential ringing of typical spark-excited transients
was largely eliminated by the present design, these transmitters improve
considerably the prospect for detecting scattering objects close to the
sounder and, also, the spatial resolution between two echoes at larger
distances from the sounder. To detect scatterers closer to than the distance
Rm, or to resolve two echoes separated in range by Rm,
it is necessary to have a pulse length less than
t = 2RmÖ(er)/c
To give an example, at 25 MHz the single radio-frequency cycle is 40
ns long. If the refractive index of the rock (Öer)
is 3.3, then Rm is 6 ft.
Coupling of the radiated electromagnetic energy into the earth is accomplished
by using broadband bow-tie or fat dipole antennas similar in shape to those
often used for UHF TV reception. Each antenna is sized to match the wavelength
in the dielectric medium. They are conveniently made from metal-sprayed
cloth or copper screen, and are placed in intimate contact with the ground.
Similar bow-ties and broadband dipoles are used for receiving. Resistively
loaded wire dipole antennas are also suitable,15 and were used
for some of the higher-frequency measurements at Giza.
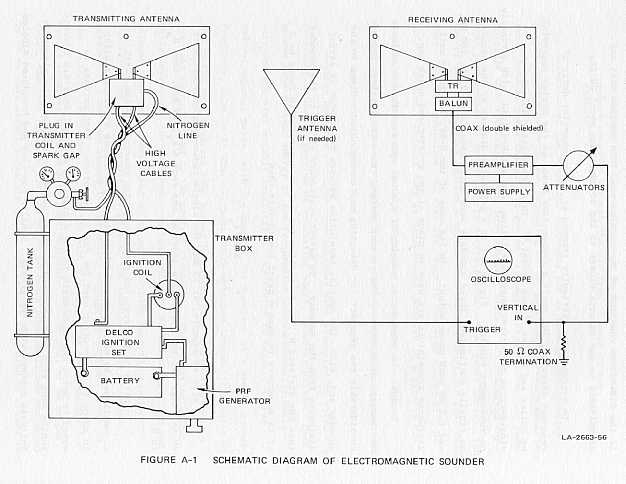
During equipment development, various screening techniques were tried
in the attempt to obtain better isolation between transmitting and receiving
antennas and to prevent reception of spurious sounder echoes from signals
propagated through the air and reflected from nearby objects. Such screening
systems adversely affected the system bandwidth, however, and generally
proved ineffective in providing isolation. Because the antennas when lying
on the ground actually do couple quite effectively into the ground, both
the isolation and the spurious echo problem have usually proved less troublesome
than anticipated. Subsequent measurements were all made without any isolation
screening, and this greatly simplified the equipment. However, as discussed
earlier, most, if not all, of the echoes seen with the equipment on the
side of Chephren's pyramid appeared to be air-propagated reflections.
The sounder display found most useful for our purposes, the A-scope
or amplitude-versus-time oscilloscope presentation, is the simplest that
allows real-time inspection of the field of view of the sounder and monitoring
of performance at the same time. Other presentations have been used in
other applications of the sounder.
Figure A-2 shows a typical receiving antenna, and Figure A-3, the 1.2-MW
transmitter unit and antenna. The equipment is entirely battery-powered;
however, a small gasoline generator has proved as convenient as the large
battery pack required by the oscilloscope.
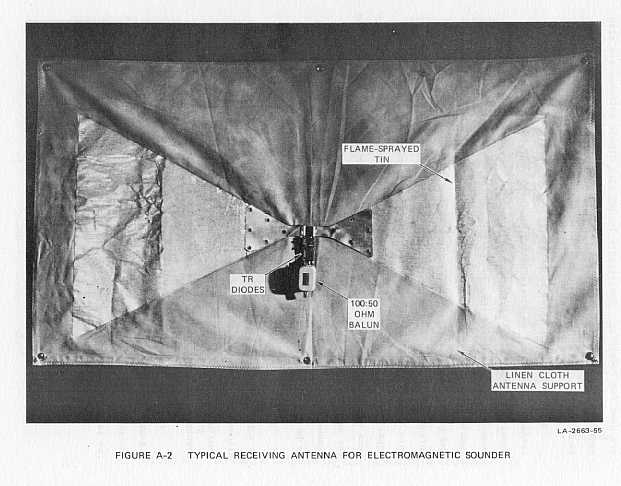

Appendix B
PROPAGATION OF ELECTROMAGNETIC WAVES IN ROCK
Electromagnetic signals propagated into a rock or soil medium from a
point source undergo attenuation with distance because of two factors:
(1) geometrical spreading of the energy as it travels away from the source,
and (2) absorptive loss in the medium. For radio signals traveling in a
straight line in a dielectric half-space from a transmitter to a receiver
R meters away, the total path loss, or ratio of the received power to the
transmitted power, is
equation B-1:
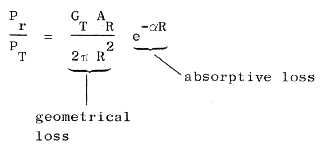
where
Pr = Received power, in watts, R meters from the transmitting
source
PT = Transmitted power, in watts
GT = Gain of transmitting antenna
AR = Effective area of receiving antenna, where GR
= 4pAR/lm2,
with lm = wavelength in the medium,
in meters
a = Fractional attenuation coefficient of
the medium, per meter
This equation is plotted in Figure B-1(a).
Figure B-1
If the radio-wave propagation is two-way, including reflection from
a scatterer, such as a passageway or tomb chamber, with an effective scattering
cross section of åm2, located
R m from transmitter and receiver, the propagation equation is
equation B-2:
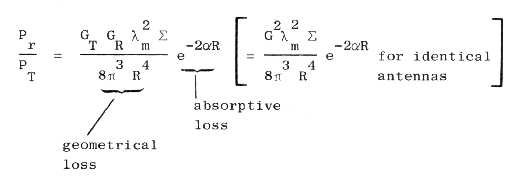
A plot of this equation is shown in Figure B-1(b).
More simply, the total system loss is the sum of the geometrical loss
in decibels and the absorptive loss in decibels. To illustrate, practical
subsurface electromagnetic sounding systems that can be built almost always
have a total available dynamic range below 150 dB (more typically, 100
dB when clutter-limited), so that one can hope to detect a target only
if the total system loss is below approximately 150 dB.
Since geometrical spreading losses will often be 30 to 50 dB (see Figure
B-1), this implies that absorptive losses must be less than 100 to 120
dB for echoes to be detected when all else is favorable. Thus, for purposes
of comparing various media, the attenuation factor, a,
is more conveniently expressed in terms of dB/ft or dB/m. In a medium where
a
= 1 dB/m, one can hope to detect targets if R < 50 m (when clutter-limited).
For lossless or low-loss media, the radio wavelength in the medium is
shortened by the refractivity of the medium, hr
= Öer, where er
is the relative dielectric constant, because the propagation velocity of
electromagnetic waves is reduced by hr.
The attenuation coefficient a, the reciprocal
distance through which the field strength falls to 1/e = 0.368 of its original
value, is related to the loss tangent of the dielectric material, tan d,
by
equation B-3:
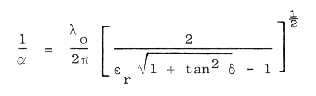
Tan d is the dissipation factor of the medium
or the reciprocal of the quality factor, Q.
For moderately low-loss cases,
equation B-4:
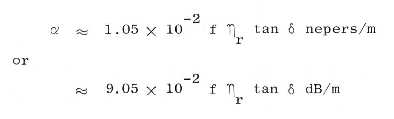
where f, the frequency, is in megahertz, and tan d
» (18/fer)s,
with s being the conductivity of the medium
in millimho/m.
The variation of either absorptive loss or relative dielectric constant
with frequency causes dispersion of a short pulse propagating through a
rock medium. Dispersion means that the form or shape of the pulse has been
altered in the process of propagation because a pulse is composed of a
"band" of frequency components that are not all equally attenuated by the
medium. In addition, in rocks and soils the relative dielectric constant
usually varies with frequency (especially when attenuation rates are high).
The parameter that best describes the scatterer (the chamber or void
to be detected) is its scattering cross section, å.
This
parameter is dependent on a matrix of variables including the physical
area of the scatterer, the shape of the scattering surface, the orientation
of the scatter with respect to the transmitter and receiver, the reflectivity
of the scattering surface, and the incident wavelength of the probing energy.
In general, a large geometrical area of the scatterer also corresponds
to a large scattering cross section. One exception to this general rule
is that objects in the "resonance region" where the operating wavelength
is comparable to the dimensions of the scattering object can have cross
sections much different than the target's physical size would suggest.
The exact prediction of cross section of objects of various shapes from
theory is possible for only a limited number of simple cases such as spheres,
cylinders, and flat plates. Objects with more complex shapes are normally
modeled and the scattering pattern experimentally determined on an antenna
range.
Figure B-2 illustrates a simplified schematic ray approximation for
scattering from an underground chamber in a pyramid using separated transmitting
and receiving sites. If a chamber is assumed to have flat roof slabs, the
scattering cross section of the slabs is easy to estimate. The maximum
scattering cross section from a flat plate is obtained with a specular
reflection. A specular reflection occurs when the angle of incidence (qi)
equals the angle of reflection (qr),
and when the transmitter, receiver, and reflecting point define a plane
that also contains the normal to the scattering surface. The specular scattering
cross section of a reflecting surface of area A is

equation B-5:
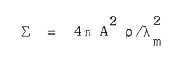
where
lm = Wavelength in the propagating
medium (rock)
r = Reflection coefficient of the scattering
interface
At least to first order, the specular cross section is independent of
the scattering angles qi and qr.
Figure B-2 also indicates that, in general, part of the power incident
on the reflecting surface will be reflected, and part will be transmitted
through the interface into the chamber. The ratio of the power reflected
to the power incident on unit area of the surface is the reflection coefficient,
r.
This reflection coefficient can be quite high in practical situations involving
a rock/air interface because the dielectric constant of rock is typically
large and/or the conductivity may be high.
For the simple case where the rock can be considered to be a loss-less
dielectric, the reflection coefficient is
equation B-6:
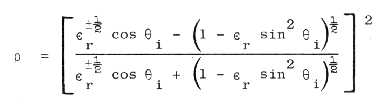
where
qi = Angle of incidence
er = Relative dielectric constant
of the rock
The plus sign in the coefficient applies where the incident electric
field is parallel to the scattering interface, and the minus sign applies
where the magnetic field of the incident wave is parallel to the interface.
For both polarizations, the reflection coefficient for a lossless medium
becomes unity if the angle of incidence exceeds a critical angle, qr,
given by
equation B-7:
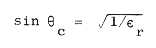
If the rock has a dielectric constant of 10, the critical angle is only
about 18°. Thus, if qi
is larger than 18°, the rock/air interface
scatters as efficiently as a metal plate of the same size and shape. Even
at normal incidence, r = 0.27 for a dielectric
constant of 10, so the scattering efficiency is reduced only about 6 dB
in this case.
Assuming as an example that the scattering interface has an area of
50 m2, the dielectric constant of the rock is 10, and the sounder
frequency is 20 MHz, the specular cross section is about 375 m2
at normal incidence and 1400 m2 for any geometry with the angle
of incidence larger than 18°.
Archaeological chambers are often built with flat surfaces so that the
specular scattering calculations assume a particular significance in the
search for these chambers. Because specular scattering cross sections are
extremely large, there is a good chance of detecting deeply buried chambers
given the accident of a favorable scattering geometry and low RF loss in
the medium. However, since specular scattering is also highly directive
if the scattering surface is several Fresnel zones across, one of the major
problems in the use of sounder techniques for archaeological prospecting
is the need to develop a systematic search technique to assure that a nearly
specular geometry is obtained for all likely chamber orientations within
the search volume.
In addition to dispersion, the geometry of large scattering surfaces
can also affect the shape of received echo pulses in ways that can be difficult
to interpret. If the scatterer is quite large, as in the case with the
mine chambers used in the sounder feasibility experiments, there is a possibility
that both rough surfaces of large area and separated specular surface spaces
will be seen too closely in range to be clearly resolved. Each of these
effects results in a reflected pulse that is longer than the original transmitted
pulse and also in a more complicated received waveshape.
As an example of such problems of "range depth of targets," consider
the geometry illustrated in Figure B-3. Suppose the target is a chamber
or void presenting a scattering surface extended in range as shown in Figure
B-3. Along the length of such a chamber, for instance, there may be many
small segments of the surface that are specular reflectors for the geometry
illustrated, but there is no single, large area that will give a dominant
specular reflection. Thus, while the incident transmitted pulse may everywhere
be but one RF cycle in length, the scattered signal reaching the receiver
will be a composite pulse longer than one cycle. This echo signal will
consist of the vector sum of contributions from glints and scattering points
along the whole distance AB in Figure B-3. From the receiver one observes
that the initial pulse has been changed in form and also "stretched" in
time by an amount proportional to the path differences (P2-P1).
When scattering from an extended target occurs, because the components
of the echo combine randomly, the total scattering cross section increases
linearly with the scattering area, rather than as the square of the area,
as with specular reflection. This means that the echo amplitude that can
be expected to be returned from rough, extended surfaces is significantly
smaller than from specular surfaces.
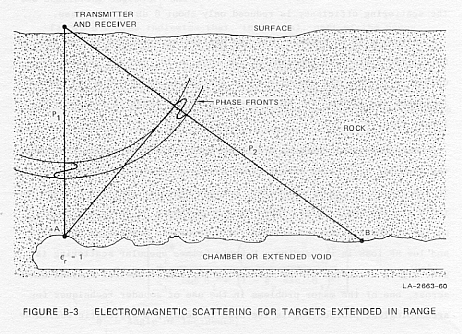
Because the greater pyramids are built of 2 to 3 million limestone blocks,
it is important to at least raise the question of scattering of electromagnetic
energy at the joints between the blocks. Fortunately, classical electromagnetic
theory predicts the losses at the joints will be small if the joint spacing
is very small compared to a wavelength. However, the periodic, regular
recurrence of such joints could produce internal scattering in the pyramid
resembling Bragg scattering. While the interior construction of the pyramids
is much more crude than the outer layers, most of the joints inside appear
to be mortar-filled. Since the dielectric constant of this mortar is close
to that of limestone, the dielectric constant across a limestone-mortar-limestone
joint is small compared to that across a limestone-air-limestone joint.
Thus, scattering at the joints would be reduced even further.
Appendix C
MINERALOGICAL DESCRIPTION OF TWO SAMPLES OF GIZA LIMESTONE
Gordon E. Brown
Assistant Professor of Mineralogy
Department of Geology
Stanford University
Two hand specimens of Giza limestone (designated G1 and G2) of Eocene
(?) age were examined megascopically and found to be significantly different
in texture and fossil content. Mineralogical characterization of these
two limestones was accomplished using a binocular microscope, powder x-ray
diffraction and emission spectrographic analysis.
Petrographic Study
Sample G1
Microscopic study of several chips of G1 at 70X magnification showed
it to be a bioclastic limestone containing numerous gastropod and brachiopod
casts and oolites set in a dense matrix ranging from microcrystalline to
sparry calcite. The matrix is cut by numerous holes and tubular channels
possibly produced by burrowing organisms in a microcrystalline calcite
ooze. Following R.L. Folk's (1961) classification of limestones, G1 can
be designated a microcrystalline allochemical limestone (Type II) which
probably formed in an aqueous environment of weak, short-lived currents
and/or a rapid rate of precipitation of microcrystalline ooze. Here the
allochem material consists of intraclasts of penecontemporaneous microcrystalline
limestone; slender, high spired gastropods (possibly Terebra) and brachiopod
fragments that have since been leached away; and oolites up to several
mm in diameter showing concentric structure. Some of the vugs that were
produced by the leaching of fossil shells and by the burrowing of organisms
contain crystals of authigenic calcite up to 0.5 mm in diameter.
Sample G2
A similar examination of several small chips of G2 at 70X magnification
showed it to be an aphanitic limestone devoid of fossil material (at this
level of detection). It can be designated a microcrystalline (Type III)
limestone according to Folk's classification scheme implying that it formed
at a rapid rate of precipitation in an environment lacking strong currents.
Powder X-ray Diffraction Study
Samples of G1 and G2 were crushed to roughly 300 mesh and mounted by
acetone slurry on glass slides. An x-ray spectrum of each sample was recorded
by continuous scanning at a speed of 1/2°
2q/min using Ni-filtered Cu Ka
radiation and a scintillation detector mounted on a Phillips goniometer.
Each sample yielded an X-ray spectrum consistent with that of calcite.
The spectrum of sample G2 showed a very weak peak at d = 2.88Å suggesting
the presence of a small amount of dolomite.
In order to concentrate other possible phases in the limestone relative
to calcite, approximately 15 grams of crushed samples of G1 and G2 were
digested in 10% acetic acid for two hours. Dilute acetic acid was chosen
so that any phosphate or clay mineral present would be unaffected by acid
digestion. The resulting undigested residues were filtered and dried, yielding
roughly 3.6 grams of G1 and about 4.7 grams of G2. Slurries of these residues
were prepared as above and a second x-ray spectrum of G1 and G2 was recorded.
G1 showed only calcite reflections as in the previous spectrum; however,
the new spectrum of G2 showed a number of additional reflections in the
2q range 5 to 15°
indicating d-spacings from 15 to 5 Å. These new reflections clearly
represent additional phases which are tentatively identified as the clay
minerals kaolinite and montmorillonite. A small amount of quartz was also
detected. The d-spacings, relative intensities and assignments of reflections
other than those due to calcite are listed in Table 1. Unambiguous assignments
are impossible for five reflections. It should be emphasized that the assignments
in Table 1 are tentative due to the weakness and number of extra reflections
that are present. However, the presence of a small clay fraction in G2
is unequivocal.
Table 1: Non-calcite X-ray Reflections Recorded from G2 Residue
| d-spacings (A) |
I |
Phase |
hkl |
| 15.53 |
ms |
montmorillonite |
001 |
| 12.59 |
w |
? |
|
| 11.33 |
s |
possibly illite (?) |
|
| 8.28 |
ms |
? |
|
| 7.27 |
m |
kaolinite |
001 |
| 6.79 |
mw |
? |
|
| 6.28 |
mw |
? |
|
| 5.50 |
mw |
montmorillonite |
003 |
| 4.16 |
mw |
quartz |
100 |
| 4.03 |
w |
dolomite |
101 |
| 3.67 |
w |
dolomite |
012 |
| 3.47 |
m |
kaolinite |
002 |
| 3.24 |
w |
quartz |
101 |
| 2.88 |
m |
dolomite |
104 |
| 1.74 |
w |
dolomite |
116, 009 |
Emission Spectrographic Analysis
The results of a semi-quantitative emission spectrographic analysis
of samples G1 and G2, performed by Dr. C.M. Taylor of the Geology Department
at Stanford on a Jarrell-Ash Spectrograph are listed on the following page.
Sample G1
Ca is the major constituent. Only Si, Mg, Al, Sr and Na are present
in amounts greater than 0.1% by weight. The low level of each of these
elements is consistent with the petrographic and x-ray analysis of sample
G1 which indicated it to be essentially pure calcite.
Sample G2
As expected, Ca is abundantly present. Si (3-5%) is present in quartz
and clay minerals. Mg (1-2%) is present in dolomite as is the Sr (0.3-0.5%).
Al (0.3-0.5%) and Na (0.2-0.3%) are presumably present in clay minerals.
These chemical data are consistent with the mineralogical findings.
Summary and Conclusions
Petrographic, x-ray and chemical study of two samples of Giza limestone
(G1 and G2) has shown that G1 is an essentially pure calcite microcrystalline
allochemical limestone containing intraclasts of microcrystalline limestone,
casts of gastropods and fragmented brachiopods and concentrically banded
oolites up to several mm in diameter. Numerous vugs contain authigenic
calcite crystals up to 0.5 mm in diameter. G2 was found to be a non-fossiliferous
microcrystalline limestone containing roughly 3% or less dolomite [MgCa(CO3)2],
quartz [SiO2] and clay minerals (possibly kaolinite [Al2(Si2O5)(OH)4]
and montmorillonite [(Mg,Ca)Al2Si(Si4O10)(OH)8]).
The mineralogy of G1 and G2 as derived from powder x-ray examination is
supported by the emission spectrographic analysis.
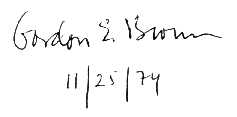
November 12, 1974
Spectrochemical Analysis of two samples:
Sample #1 = Pyramid with fossils
Sample #2 = Pyramid, no fossils
| Element |
Sample #1 |
Sample #2 |
| Al |
0.15-0.25% |
0.3-0.5% |
| Ba |
0.0002-0.0003 |
0.0002-0.0003 |
| B |
0.003-0.004 |
0.0015-0.002 |
| Ca |
Major |
Major |
| Cr |
0.001 |
0.001-0.002 |
| Co |
0.0002-0.0004 |
0.0002-0.0004 |
| Cu |
0.00005-0.00007 |
0.0015-0.0025 |
| Fe |
0.06-0.08% |
0.03-0.05% |
| Mg |
0.5-0.8% |
1-2% |
| Mn |
0.02-0.04% |
0.001-0.002 |
| Ni |
0.0002-0.0003 |
0.0002-0.0003 |
| Si |
0.1-0.2% |
Major 3-5% |
| Ag |
0.00004-0.00006 |
0.00004-0.00006 |
| Na |
0.08-0.15% |
0.2-0.3% |
| Sr |
0.08-0.12 |
0.3-0.5% |
| Sn |
0.001-0.002 |
N.D. |
| Ti |
0.003-0.004 |
0.005-0.007 |
| V |
0.001-0.002 |
0.001 |
| Zr |
N.D. |
0.0005-0.0007 |
Charles M. Taylor
REFERENCES
1. A. Fakhry, The Pyramids (University of Chicago Press, Chicago,
1974).
2. Selim Hassan, Excavations at Giza (Cairo, 1934).
3. L. W. Alvarez, "One Researcher's Personal Account," Adventures
in Experimental Physics (World Science Communications, Princeton, New
Jersey, 1972).
4. L. W. Alvarez et al., "Search for Hidden Chambers in the Pyramids,"
Science,
Vol. 167, pp. 832-839 (6 February 1970).
5. G. Alexander, "No Secret Room Found in Pyramid," The Los Angeles
Times (April 22, 1974).
6. L. T. Dolphin, R. L. Bollen, and G. N. Oetzel, "An Underground Electromagnetic
Sounder Experiment," Geophysics, Vol. 39, No. 1 (February 1974).
7. P. Tompkins, Secrets of the Great Pyramid (Harper & Row,
San Francisco and New York City, 1971).
8. I.E.S. Edwards, The Pyramids of Egypt (Penguin Books, Harmondsworth,
Middlesex, England, 1947, Rev. 1961).
9. K. Mendelssohn, "A Scientist Looks at the Pyramids," American
Scientist, Vol. 59, pp. 210-220 (1971).
10. K. Mendelssohn, "The Riddle of the Pyramids" (Thames and Hudson,
Cambridge, England, 1974).
11. A. Hassan, "Hieroglyphic Inscriptions on the Third Pyramid." In
press.
12. K. Landecker and K. S. Imrie, "A Novel Type of High Power Pulse
Transmitter," Australian J. Phys., Vol. 13, p. 638 (1960).
13. M. W. Hellar, Jr., and W. G. Holter, "A Transmission Line Oscillatory
Pulse Generator," Proc. Nat. Electronics Conf., Vol. IX, National
Electronics Conference, Inc., Chicago, 1954.
14. R. W. Samsel, "Pulse Generator," U.S. Patent No. 2,792,508 (1967).
15. G. C. Rose and R. S. Vickers, "Calculated and Experimental Response
of Resistively Loaded V Antennas to Impulsive Excitation," Int. J. Electronics,
Vol. 37, No. 2, pp. 261-271 (1974).
spelling and punctuation checked 28July02 RPS
 lambert@ldolphin.org

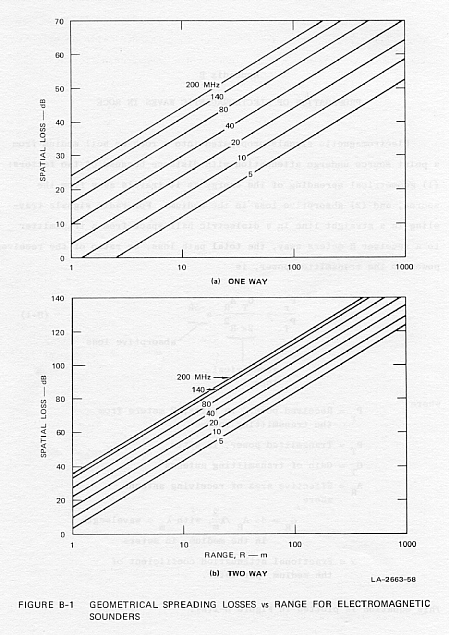